A Holiday Plunge
Housing is about to shift to the Holiday Market when both the supply of available homes and purchase demand falls to their lowest levels of the year on New Year’s Day.
The Holiday Market
With all the distractions of the holidays, supply and demand will plunge through the end of the year.
Immediately after all the little ones enjoy going door-to-door trick-or-treating, all the Halloween decorations come down in the snap of a finger. It is the first sign that a holiday downshift is upon us. Daylight savings ends in early November; clocks roll back an hour, and suddenly, it is dark at 5 PM. This is yet another sign. Starbucks cups, holiday romantic movies on Netflix, and neighbors’ early installation of Christmas lights are all further indications that the festivities and distractions of the season are about to hit the housing market.
With Thanksgiving next week, the diversion of family gatherings, holiday parties, plenty of shopping, eggnog, and nonstop festive music has arrived. Orange County transitions to the Holiday Market starting this week in the blink of an eye. The inventory plunges, demand plunges, and the Expected Market Time will not change much this year. This is the season where many sellers and buyers will place their real estate goals and needs on pause to enjoy the merriment.
Last year, the number of available homes grew all year due to surging mortgage rates until it peaked in August at 4,069 homes, reaching levels last seen 22 months earlier in October 2020. After peaking, the inventory dropped to 3,581 to start November, shedding 25%. It was hard to imagine that it could fall further, but during the Holiday Market, November through the New Year, it plunged another 29%, reaching 2,530 during the first week of January. The 3-year average inventory drop before COVID (2017 to 2019) was 23%.
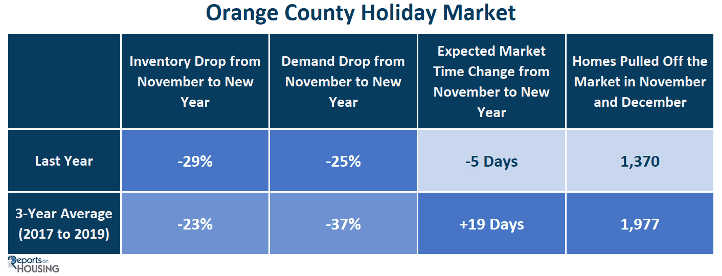
Demand, a snapshot of the number of new pending sales over the prior month, tumbled by 25%, from 1,202 to 900 pending sales during last year’s Holiday Market. The 3-year average dive in demand prior to COVID was 37%. The Expected Market Time, the number of days to sell all Orange County listings at the current buying pace, dropped from 89 to 84 days last year, shedding 5 days. That was far different than the 19-day rise prior to COVID. The difference is because of chronically low inventory levels compared to pre-COVID years.
Contributing to the drop in inventory is the rise in the number of homes pulled off the market in November and December. Last year, 1,370 sellers threw in the proverbial towel, unable to find success and opting to place their desire to sell on hold until a later date. That is more than half the current inventory. The pre-COVID 3-year average was 1,977 when many more homes were available.
The inventory drops during the holidays because fewer homeowners list their homes at the end of the year. The fewest sellers enter the fray in December, 64% less than May, the peak month with the greatest number of new sellers. The second fewest come on in November, 46% less than May’s peak. Fewer FOR-SALE signs combined with sellers throwing in the towel pave the way for the inventory to drop substantially.
Demand drops, and many buyers sideline their home-buying efforts. The buyers that continue their search are faced with a diminishing number of available homes, also contributing to a drop in pending sales. Buyers cannot purchase what is unavailable, and the entry levels have been starved for fresh inventory all year.
The inventory has not changed much from the start of the year, actually falling for the first several months. It appeared as if it had reached a normal peak in August at 2,475, but due to rates rising above 7% since July and even eclipsing 8% last month, Orange County just reached a new peak this week at 2,496 homes. Yet, it is still the second lowest level to start November since tracking began in 2004, behind 2021. From here, expect the inventory to drop to just under 1,800 homes to start 2024.
Demand is currently at 1,223 pending sales, similar to last year’s level at the start of November. Expect demand to drop to around 900 pending sales and match the start of this year, the lowest start since tracking. The Expected Market Time will not change much from now through the end of the year and will start January at around 59 days, much faster than the 84-day start to this year.
The Orange County Holiday Market has officially arrived with Thanksgiving a little more than a week away. Many sellers, prospective sellers, and buyers will divert their attention from housing to enjoy the yuletide season.
Active Listings
The active inventory climbed by 4% and hit a new, late peak.
The active listing inventory increased by 90 homes in the past two weeks, up 4%, and now sits at 2,496 homes, its highest level since January. It appeared as if Orange County reached an inventory peak at the start of August at 4,475, but this late surge eclipsed that level and reached a new peak. It was not behaving like a normal peak anyhow, not changing much from week to week. Typically, the inventory slowly falls after peaking, gaining momentum as the end of the year draws closer. Now that the Holiday Market has arrived, today will be the peak because November and December are months with the fewest homes coming on the market, and many unsuccessful sellers throw in the towel and pull their homes off the market. As a result, the inventory will plunge from now until New Year’s Day.
Last year, the inventory was 3,581 homes, 43% higher, or 1,081 more. The 3-year average before COVID (2017 through 2019) is 5,822, an additional 3,326 homes, or 133% extra, more than double where it stands today.

Homeowners continue to “kick back” in their homes, unwilling to move due to their current underlying, locked-in, low fixed-rate mortgage. For October, 1,910 new sellers entered the market in Orange County, 1,093 fewer than the 3-year average before COVID (2017 to 2019), 36% less.
Demand
Demand dropped by another 5% in the past couple of weeks.
Demand, a snapshot of the number of new pending sales over the prior month, decreased from 1,284 to 1,223 in the past couple of weeks, down 61 pending sales, or 5%. Demand levels are very low, inherent levels. This is due to the time of the year, with fewer homes coming on the market. It is also because of the sky-high mortgage rate environment remaining stubbornly above 7% and even surpassing 8% last month. As sellers pull their homes off the market and fewer homeowners opt to sell in November and December, demand will continue to slowly fall and reach a bottom on New Year’s Day.
Last year, demand was at 1,202, 2% lower than today, or 21 fewer. The 3-year average before COVID (2017 to 2019) was 2,139 pending sales, 75% more than today, or an additional 916.

With the supply rising and demand falling, the Expected Market Time (the number of days to sell all Orange County listings at the current buying pace) increased from 56 to 61 days in the past couple of weeks, its highest level since the January. Last year, the Expected Market Time was 89 days, slower than today. The 3-year average before COVID was 85 days, also slower than today.
Luxury End
The luxury market slowed considerably in the past couple of weeks.
In the past couple of weeks, the luxury inventory of homes priced above $2 million increased from 807 to 819 homes, up 12, or 1%. Luxury demand decreased by 30 pending sales, down 16%, and now sits at 162, its lowest level since February. With inventory rising and demand plunging, the Expected Market Time for luxury homes priced above $2 million increased from 126 to 152 days, its highest level since January. At 152 days, the luxury market has slowed substantially since April when it was 101 days, a little over 3 months. Luxury sellers must carefully approach the housing market.
Year over year, luxury demand is up by 27 pending sales or 20%, and the active luxury listing inventory is up by 44 homes or 6%. Last year’s Expected Market Time was 172 days, slower than today.
For homes priced between $2 million and $4 million, the Expected Market Time in the past two weeks increased from 87 to 103 days. For homes priced between $4 million and $6 million, the Expected Market Time increased from 175 to 231 days. For homes priced above $6 million, the Expected Market Time increased from 385 to 469 days. At 469 days, a seller would be looking at placing their home into escrow around February 2025.

Orange County Housing Summary
- The active listing inventory in the past couple of weeks increased by 90 homes, up 4%, and now sits at 2,496. In October, 36% fewer homes came on the market compared to the 3-year average before COVID (2017 to 2019), 1,093 less. Last year, there were 3,581 homes on the market, 1,085 more homes, or 43% higher. The 3-year average before COVID (2017 to 2019) was 5,822, or 133% more, more than double.
- Demand, the number of pending sales over the prior month, decreased by 61 pending sales in the past two weeks, down 5%, and now totals 1,223. Last year, there were 1,202 pending sales, 2% fewer than today. The 3-year average before COVID (2017 to 2019) was 2,139, or 75% more.
- With the inventory rising and demand falling, the Expected Market Time, the number of days to sell all Orange County listings at the current buying pace, increased from 56 to 61 days in the past couple of weeks, its highest level since January. It was 89 days last year, slower than today.
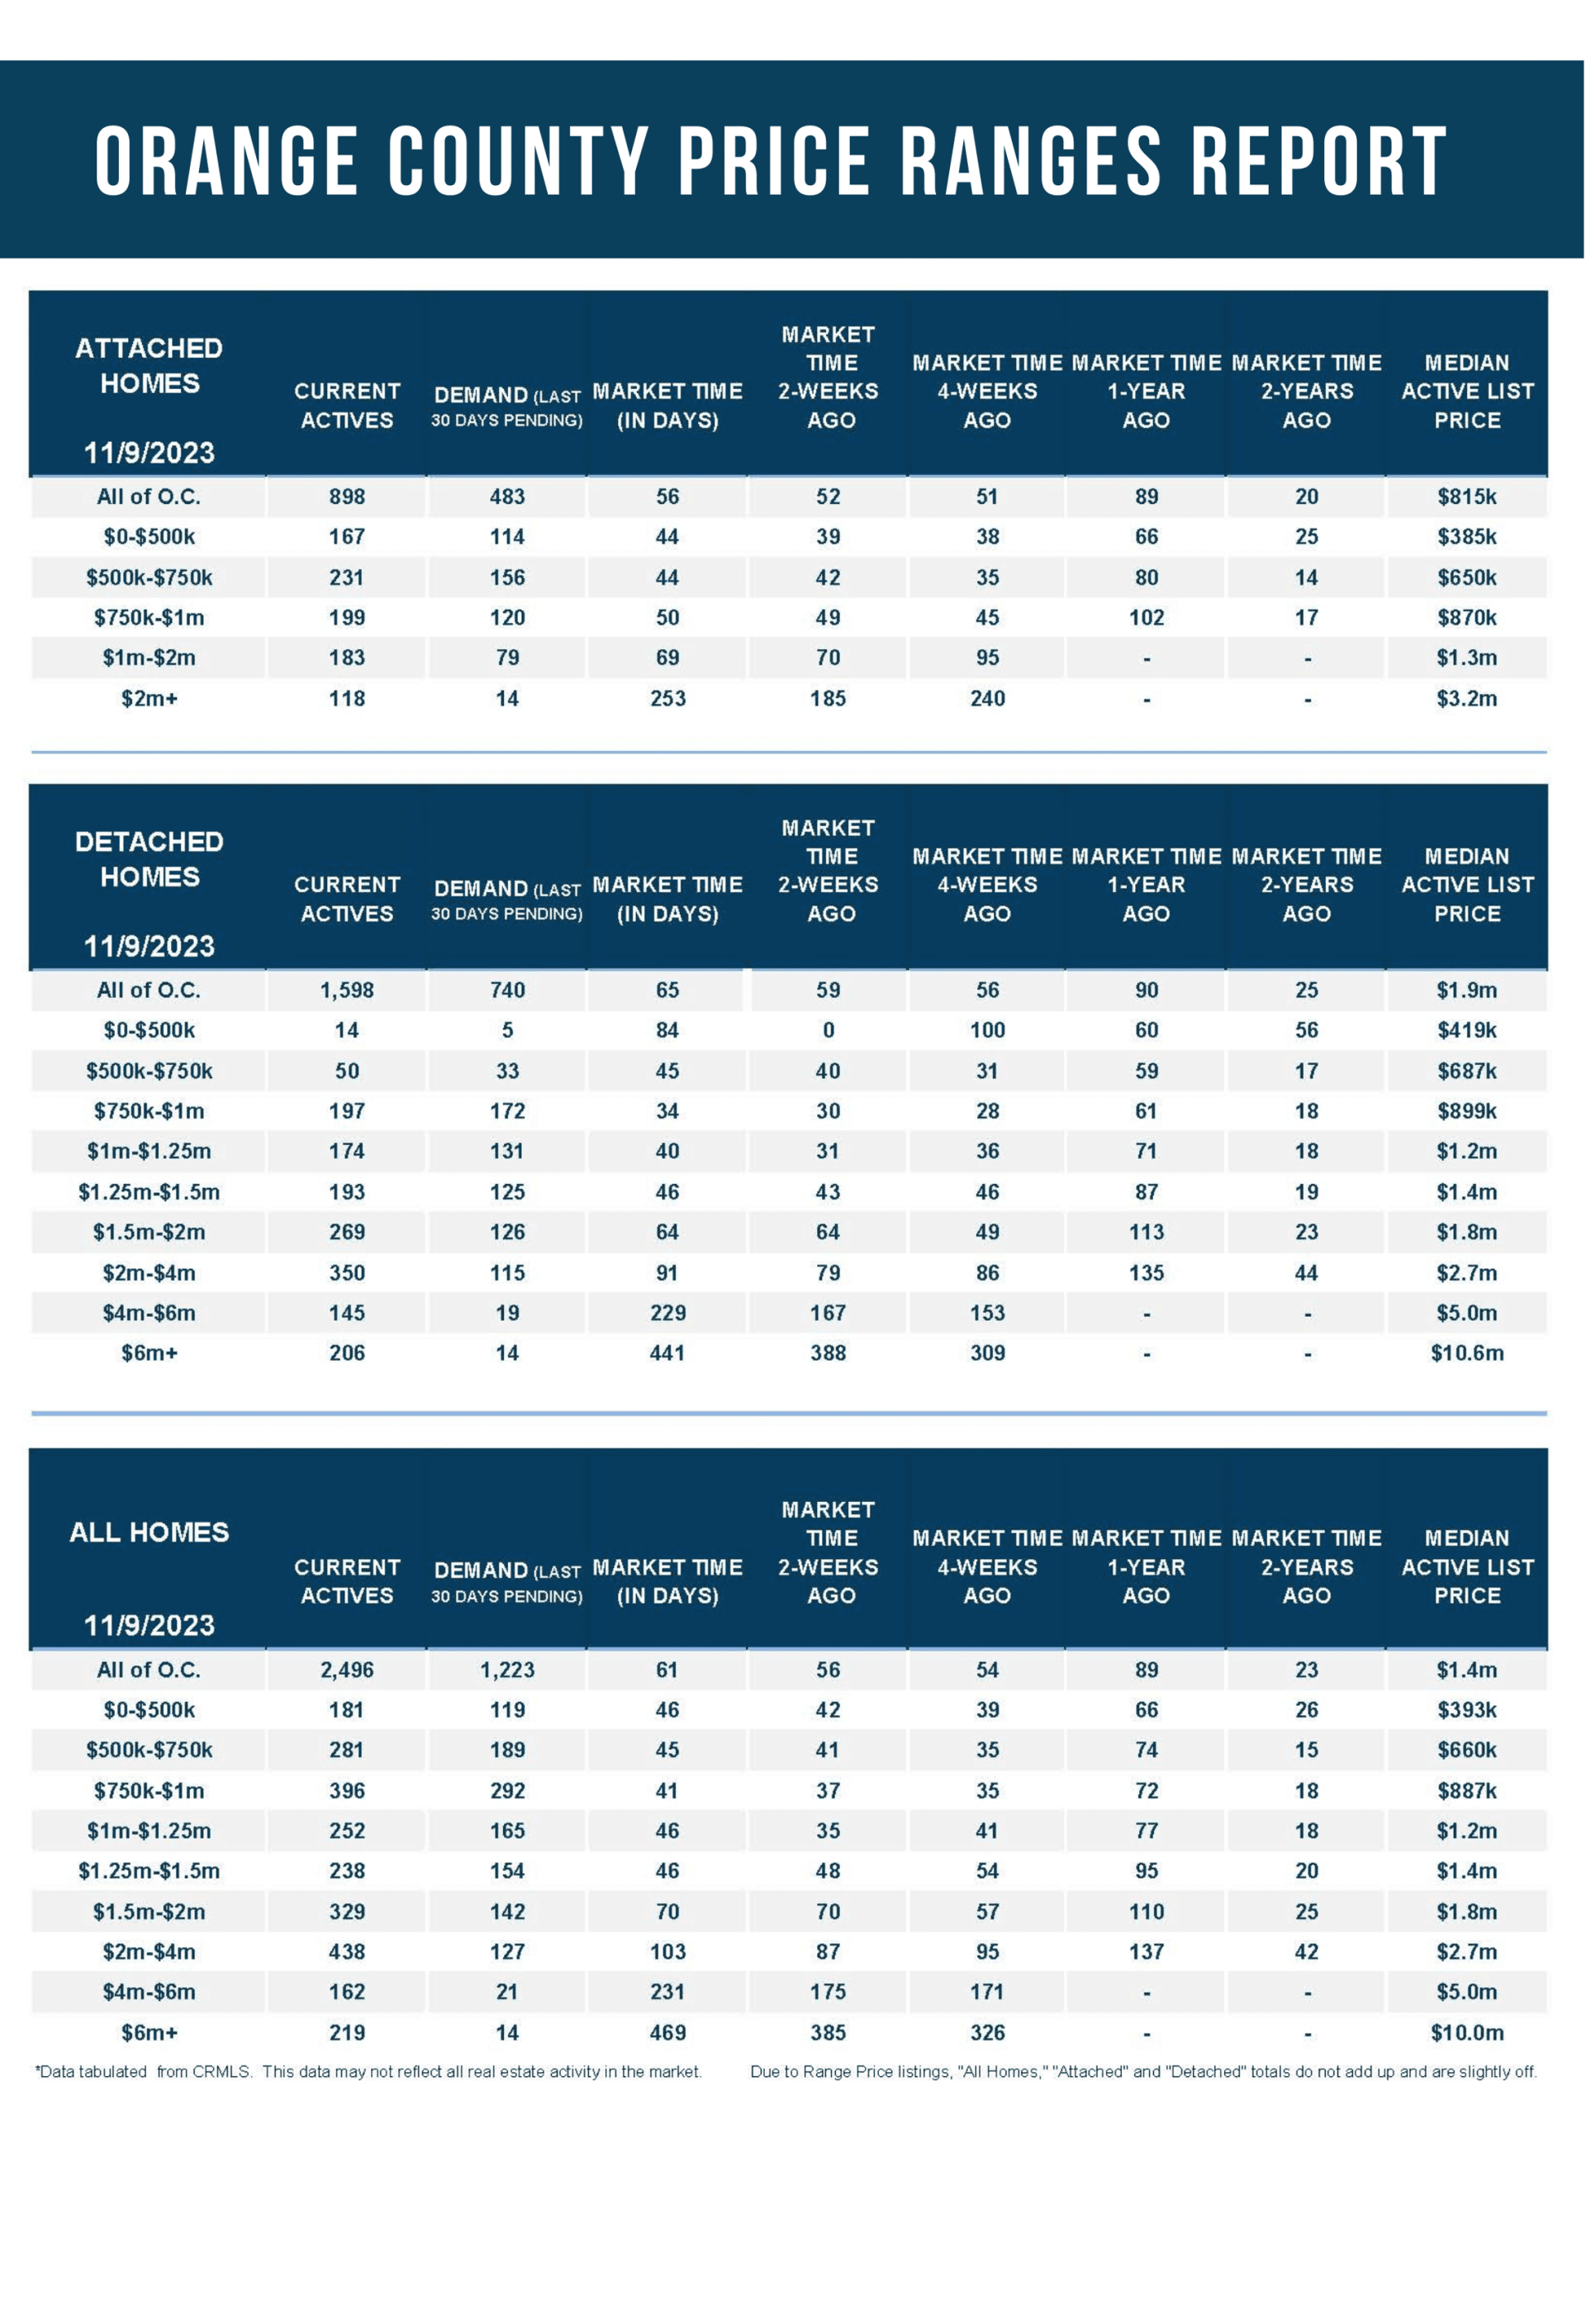
- For homes priced below $750,000, the Expected Market Time increased from 42 to 45 days. This range represents 18% of the active inventory and 25% of demand.
- For homes priced between $750,000 and $1 million, the Expected Market Time increased from 37 to 41 days. This range represents 16% of the active inventory and 24% of demand.
- For homes priced between $1 million and $1.25 million, the Expected Market Time increased from 35 to 46 days. This range represents 10% of the active inventory and 13% of demand.
- For homes priced between $1.25 million and $1.5 million, the Expected Market Time decreased from 48 to 46 days. This range represents 10% of the active inventory and 13% of demand.
- For homes priced between $1.5 million and $2 million, the Expected Market Time remained unchanged at 70 days. This range represents 13% of the active inventory and 12% of demand.
- For homes priced between $2 million and $4 million, the Expected Market Time in the past two weeks increased from 87 to 103 days. For homes priced between $4 million and $6 million, the Expected Market Time increased from 175 to 231 days. For homes priced above $6 million, the Expected Market Time increased from 385 to 469 days.
- The luxury end, all homes above $2 million, account for 33% of the inventory and 13% of demand.
- Distressed homes, both short sales and foreclosures combined, comprised only 0.2% of all listings and 0.1% of demand. Only four foreclosures and two short sales are available today in Orange County, with six total distressed homes on the active market, up two from two weeks ago. Last year, seven distressed homes were on the market, similar to today.
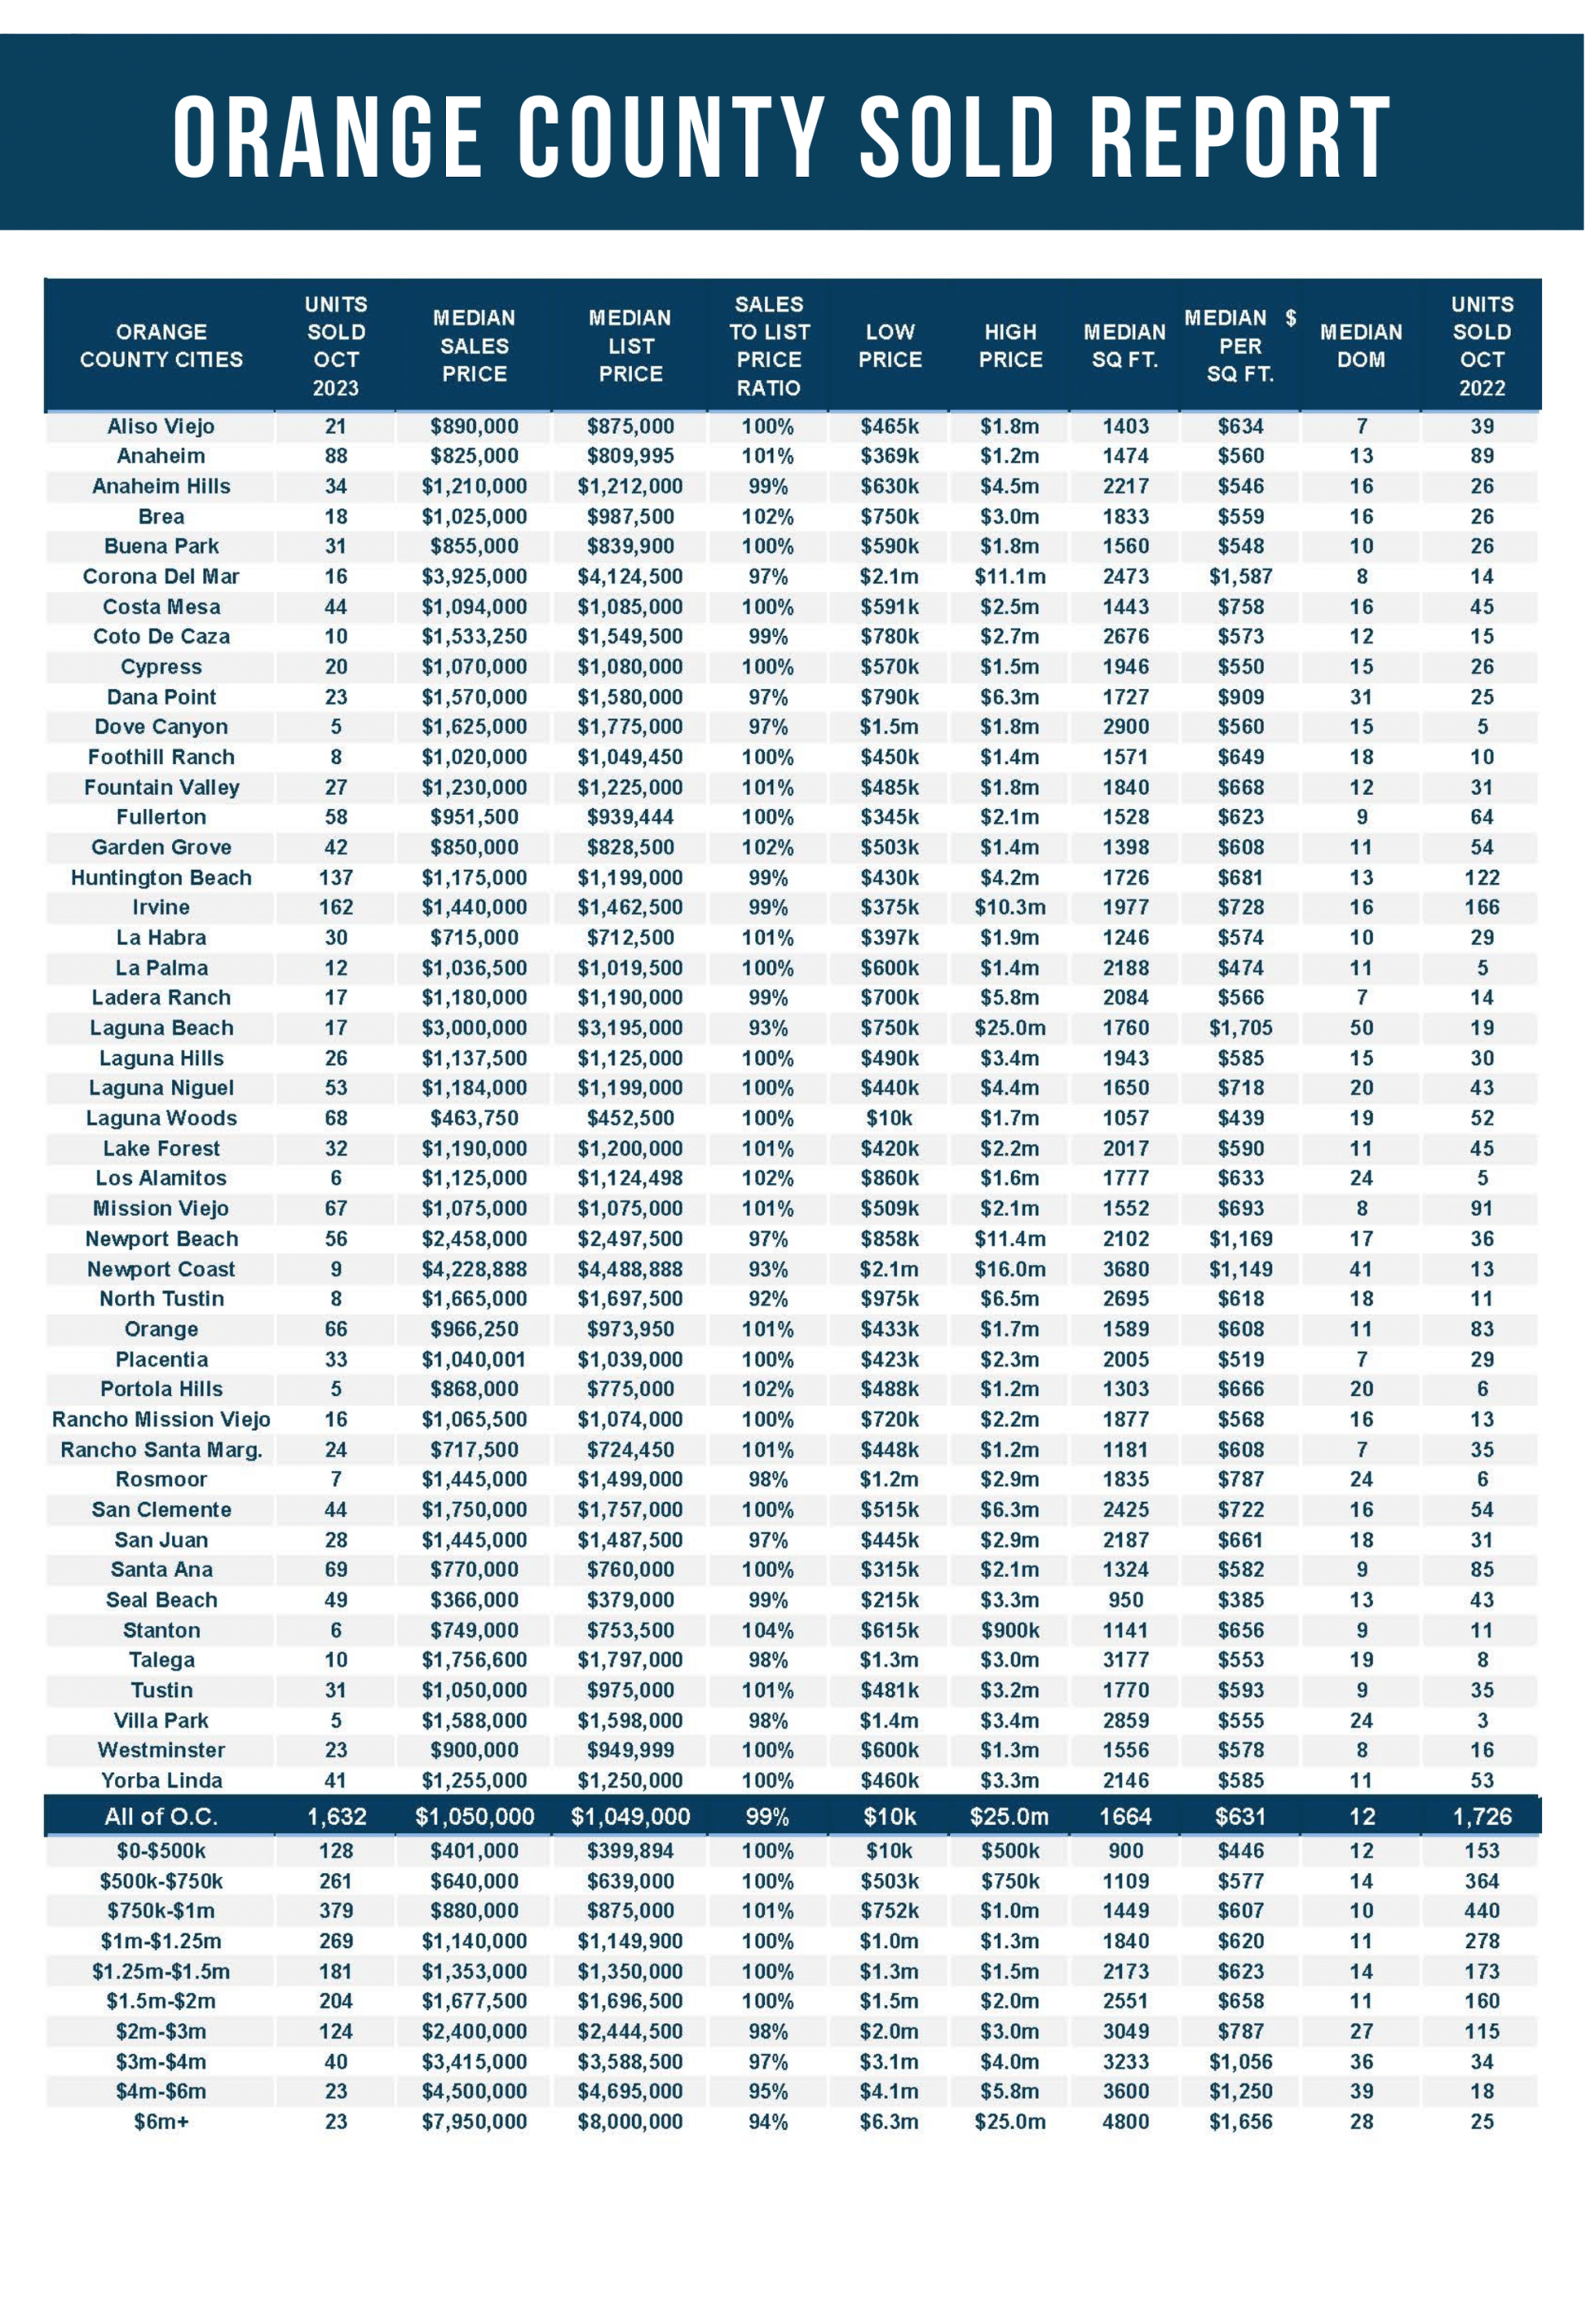
- There were 1,632 closed residential resales in October, 5% less than October 2022’s 1,726 closed sales. October marked a 1% drop compared to September 2023. The sales-to-list price ratio was 98.9% for all of Orange County. Foreclosures accounted for 0.1% of all closed sales, and there were not closed short sales. That means that 99.9% of all sales were good ol’ fashioned sellers with equity.