Housing’s seasonal shift is underway, as the Autumn Market ushers in a distinctly different pace from the rest of the year.
The Fall Market
The Expected Market Time, the speed of the market, is considerably higher than in the spring, and it won’t change much through the Fall Market.
To every child’s delight, Halloween costumes are now on display at Costco. Disneyland transformed its resorts into “Halloween Time” a couple of weeks ago, and Starbucks’ wildly popular Pumpkin Spice Latte (PSL) returned last week. College football kicks into full gear this week, with NFL Week 1 around the corner. The 2026 Autumnal Equinox, the official first day of fall, arrives on Tuesday, September 22nd, yet all the signs are already here: fall has arrived!
Housing is highly seasonal, and each season behaves differently. Like Costco, Disneyland, Starbucks, and football, the fall season starts now. The Fall Market runs from the very end of August through mid-November, the week before Thanksgiving. From there, housing transitions to the Holiday Market, the year's slowest season.
In Orange County, the typical Fall Market is when both supply (the total number of homes available for purchase) and demand (a snapshot of new pending sales over the prior month) slowly decline at a similar pace. The speed of the market, Expected Market Time (the number of days it takes to sell all Orange County listings at the current buying pace), does not change much.
Since mortgage rates surged in 2022, the housing market has responded differently from year to year. The Fall Market has been especially influenced by fluctuations in mortgage rates. Lower rates have accelerated the market, while higher rates have cooled housing. These variations have been more pronounced during this time of year in recent years. Last year, mortgage rates dropped below 6.5% on September 3rd and never looked back. That resulted in a much larger drop in inventory (-16%) than in demand (-5%). The Expected Market Time dropped from 94 to 83 days (-11), a noticeable shift.
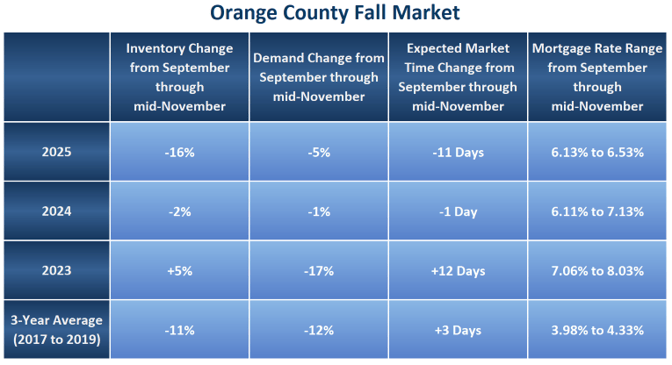
In 2024, mortgage rates fell to 6.11% in mid-September, then ballooned to 7.13% by the start of November, a 1% increase. Supply and demand declined at a similar pace, and the Expected Market Time fell by only a day from September to mid-November. Mortgage rates climbed from 7.06% at the start of the 2023 Fall Market to 8.03% by mid-October. As rates reached their highest level since August 2000, weaker home affordability led to a rise in inventory (+5%) and a sharp drop in demand (-17%). The Expected Market Time grew by 11 days. The 3-year average before COVID (2017-2019) was marked by a similar drop in supply (-11%) and demand (-12%). The average change in the Expected Market Time was a 3-day rise, nearly undetectable.
During the Fall Market in Orange County, fewer homes are listed for sale. The busiest time of the year for new listings is from March through August. Looking at the average over the past 3 years (2023-2025), the most homes come on in May (2,625), followed by July (2,610) and April (2,575). Only 2,164 homes are listed in September, 18% fewer than May, and 2,104 are listed in October, 23% fewer than May.
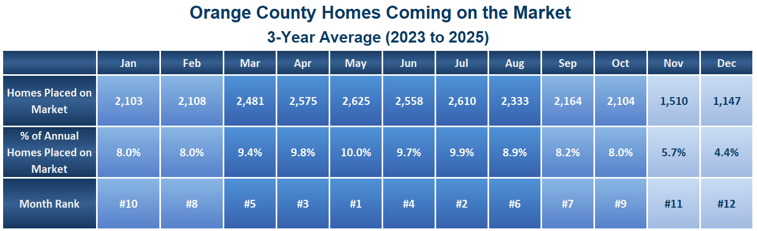
In addition, an elevated number of unsuccessful sellers pull their homes off the market as the strongest time of the year, the Spring and Summer Markets, comes to an end. The supply of available homes drops in the fall due to fewer new listings and sellers throwing in the proverbial towel.
With kids back in school and summer vacations just a memory, many people, especially families with school-aged children, prefer to identify a home and sign a purchase contract during the Spring and Summer Markets. As a result, buyer demand slowly falls during the Fall Market.
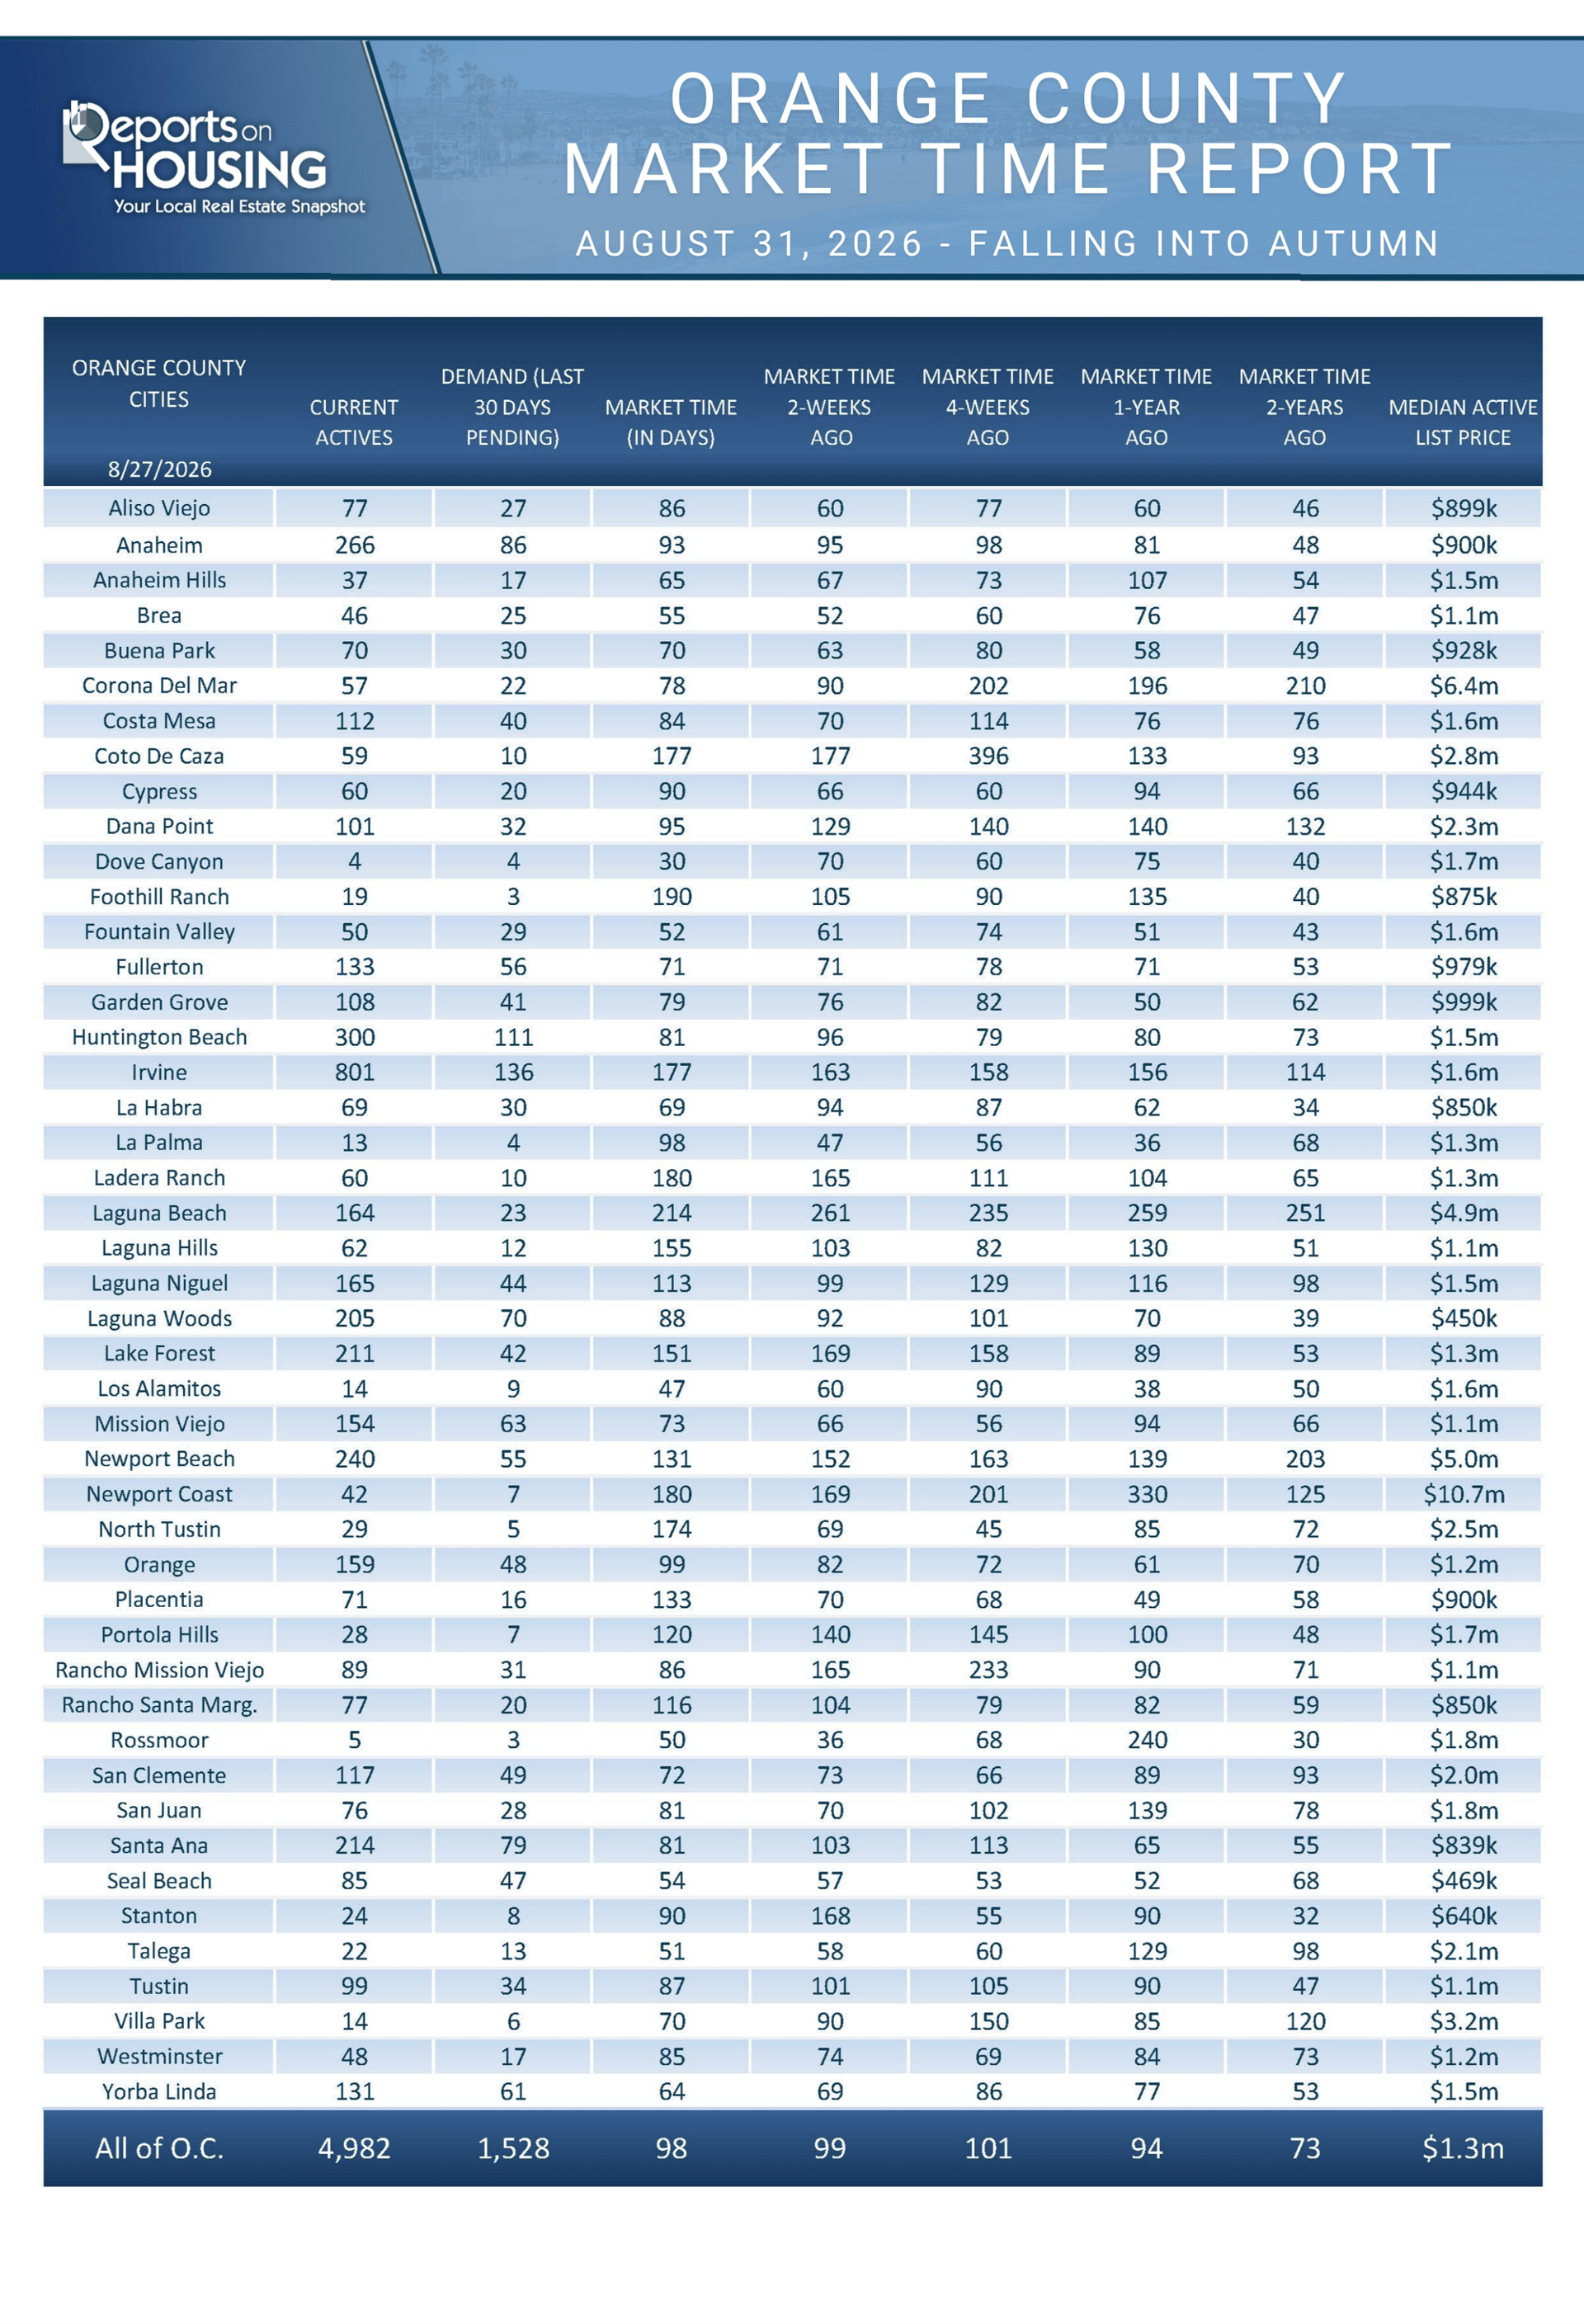
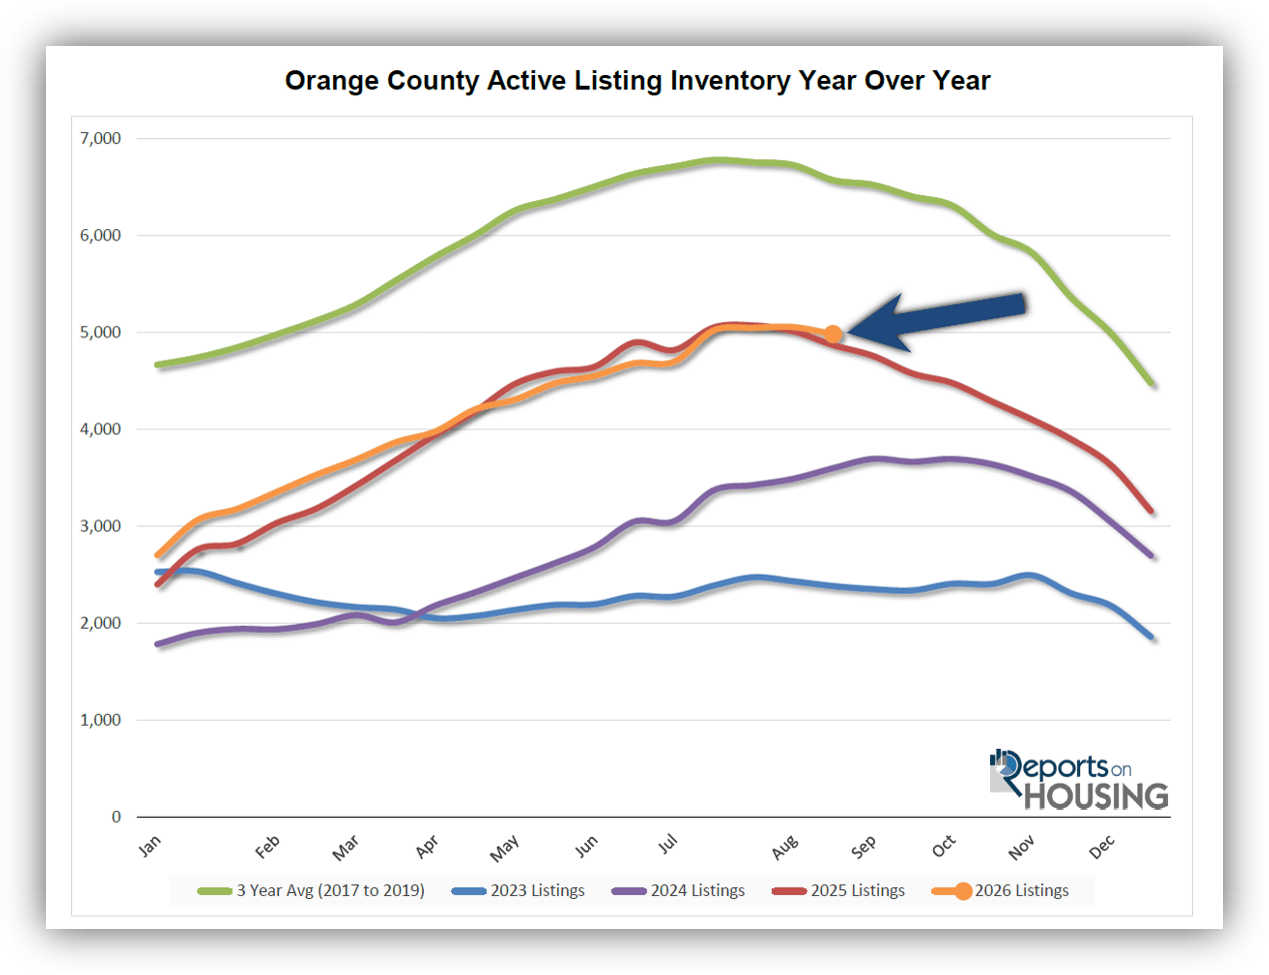
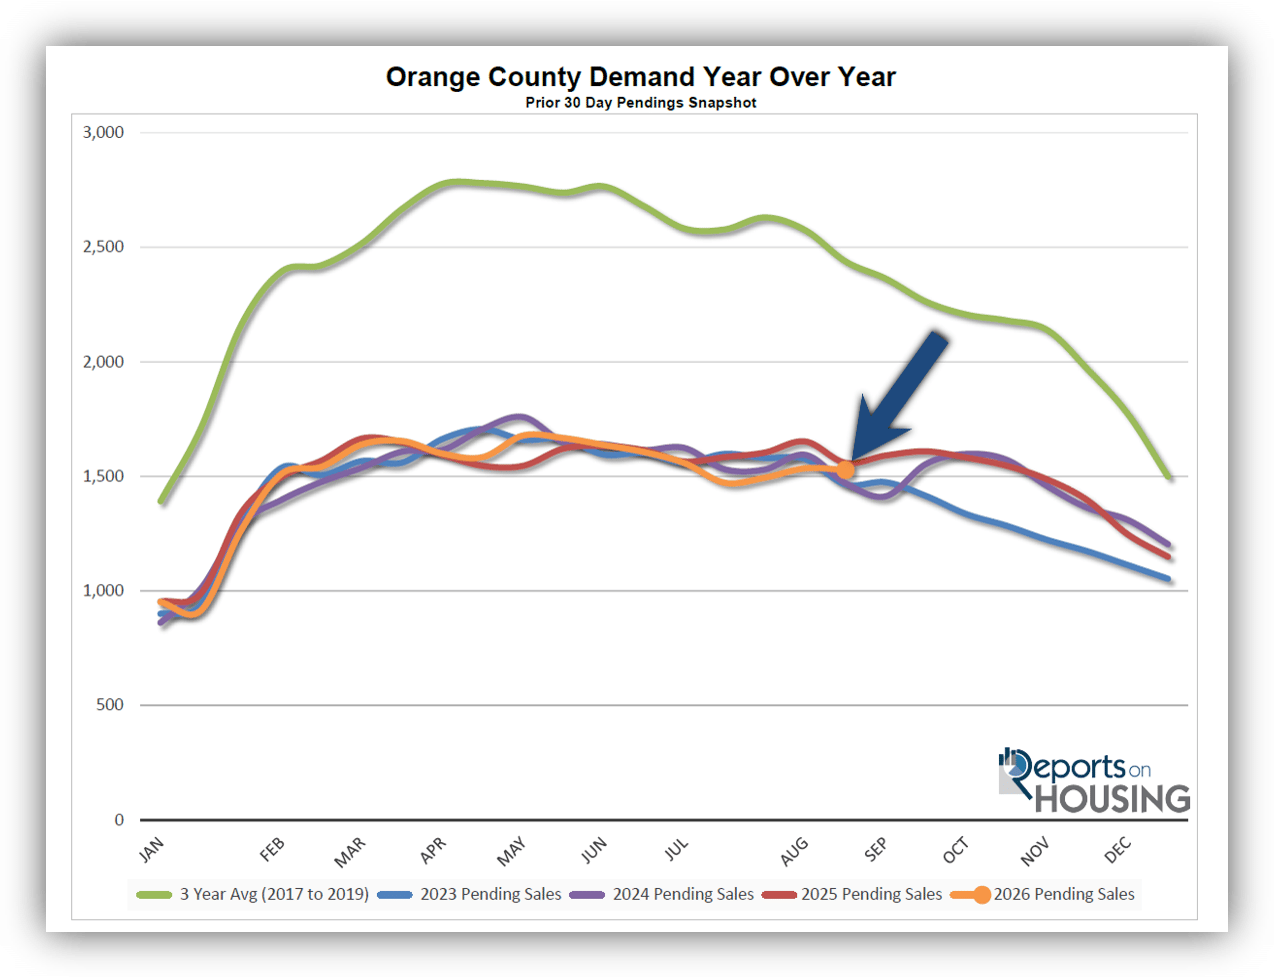
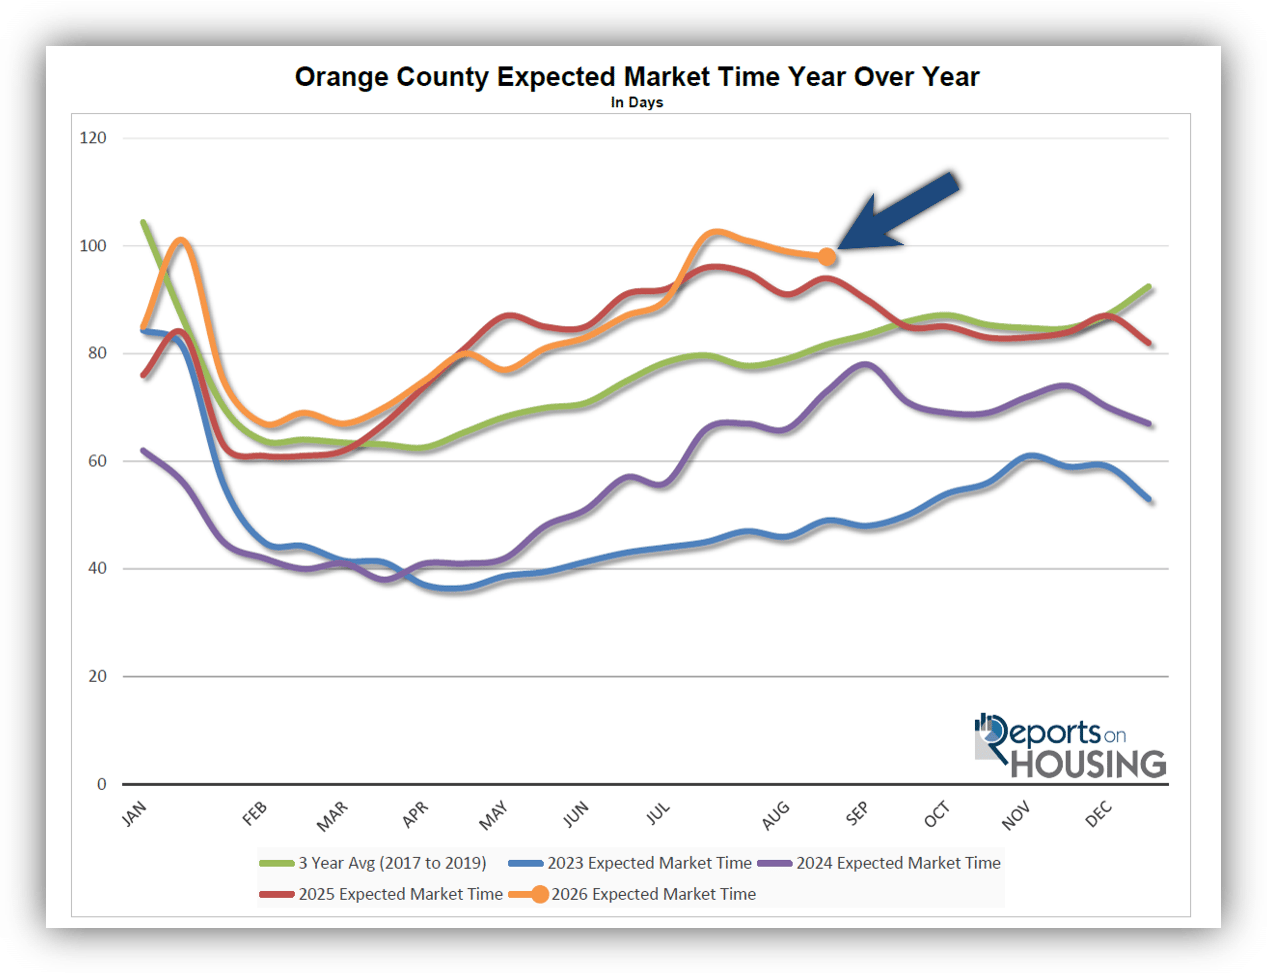
In Orange County, the inventory may have peaked a couple of weeks ago, falling from 5,054 to 4,982 today, up 113 (+2%) from last year. Demand has been slowly falling since its mid-May peak of 1,678 pending sales, down to 1,528 today, a decline of 150 (-9%) from last year. The Expected Market Time is at 98 days, considerably slower than the 77-day May reading, yet similar to last year’s 94-day start to the Fall Market.
If rates continue to hover around 6.75% as they have since mid-July, expect the Fall Market to look much like 2024, when both supply and demand fell only slightly and the Expected Market Time was nearly unchanged.
ATTENTION BUYERS: Do not expect to get a “deal” in today’s market. Although the market is sluggish compared to previous years, there are not enough sellers who “must” sell. Pricing is sticky. Buyers looking for deals and writing lowball offers will not find success. In terms of negotiating power, the Orange County housing market is leaning slightly in favor of buyers, meaning buyers get to call more of the shots. That does not include a major discount in home prices.
ATTENTION SELLERS: The Fall Market requires a meticulous, cautious approach to pricing. Precision pricing is one of the most important factors in successfully approaching the housing market and securing success. Far too many sellers overprice their homes without properly considering every recent comparable closed and pending sale. This careful consideration allows sellers to arrive at a home’s Fair Market Value, the most probable price the market is willing to pay for a home, considering a home’s condition, upgrades, location, and amenities. Buyers are unwilling to overpay for a home.
Active Listings
The inventory decreased by 72 in the past couple of weeks.
The active listing inventory decreased by 72 homes over the past two weeks to 4,982 (-1%). The inventory may have peaked two weeks ago, in mid-August. It typically peaks between July and August. Last year, it peaked at the end of July. The inventory should slowly decline over the next couple of months, then fall faster from mid-November through the New Year during the Holiday Market. Expect more sellers to pull their homes off the market now that housing is transitioning into the slower Fall Market season.
Last year, the inventory was at 4,869 homes,with 113 fewer homes (-2%). The 3-year average before COVID (2017 through 2019) was 6,569, an additional 1,587 homes, or 32% more.
Homeowners continue to “hunker down” in their homes, unwilling to move because of their current, underlying, locked-in, low fixed-rate mortgage. This trend has been easing from the lows established in 2023. Through July, 18,948 homes were placed on the market in Orange County, 6,899 fewer than the 3-year average before COVID (2017-2019), 27% less. In 2025, 19,520 homes entered the market (3% more), compared with 17,052 in 2024 (10% fewer) and 14,616 in 2023 (23% fewer). Slightly fewer homes have been coming to market this year than last.
Demand
Demand was nearly unchanged in the past couple of weeks.
Demand, a snapshot of the number of new pending sales over the prior month, decreased from 1,535 to 1,528 in the past couple of weeks, down seven pending sales, nearly unchanged. With mortgage rates noticeably higher year over year, 6.87% today (Mortgage News Daily) compared to 6.53% a year ago, expect demand to be a bit weaker to close out the year. It will slowly decline over the next couple of months, then drop considerably from mid-November through the end of the year. With inflation pressures stemming from the conflict in Iran, the Fed is poised to raise the Federal Funds Rate this year, adding further pressure to an already elevated interest-rate environment. Rates had reached 6% the week before the conflict began.
Last year, demand was 1,559, with 31 additional pending sales (+2%). The 3-year average before COVID (2017 to 2019) was 2,438 pending sales, 60% more than today, or an additional 910.
As the Federal Reserve has indicated, it is essential to monitor all economic releases for signs of a slowdown. These releases can cause mortgage rates to rise or fall, depending on how they compare with market expectations. It is also important to monitor any developments in the Iran conflict and its impact on the oil market, and ultimately inflation, which can also cause mortgage rates to rise or fall. This week is jobs week, which includes the number of job openings, wages, and the number of jobs created or lost, one of the month’s most important economic data points. Next week, the Consumer Price Index (CPI) and the Producer Price Index (PPI) will be released, two key indicators of inflation. It will be a pivotal two weeks for mortgage rates.
Expected Market Time
The Expected Market Time dropped by one day over the past couple of weeks.
With the supply of available homes falling by 72 homes, down 1%, and demand rising by 7 pending sales, nearly unchanged, the Expected Market Time (the number of days it takes to sell all Orange County listings at the current buying pace) decreased from 99 to 98 days in the past couple of weeks.
Last year, it was 94 days, similar to today. The 3-year average before COVID (2017 to 2019) was 82 days, considerably faster than today.
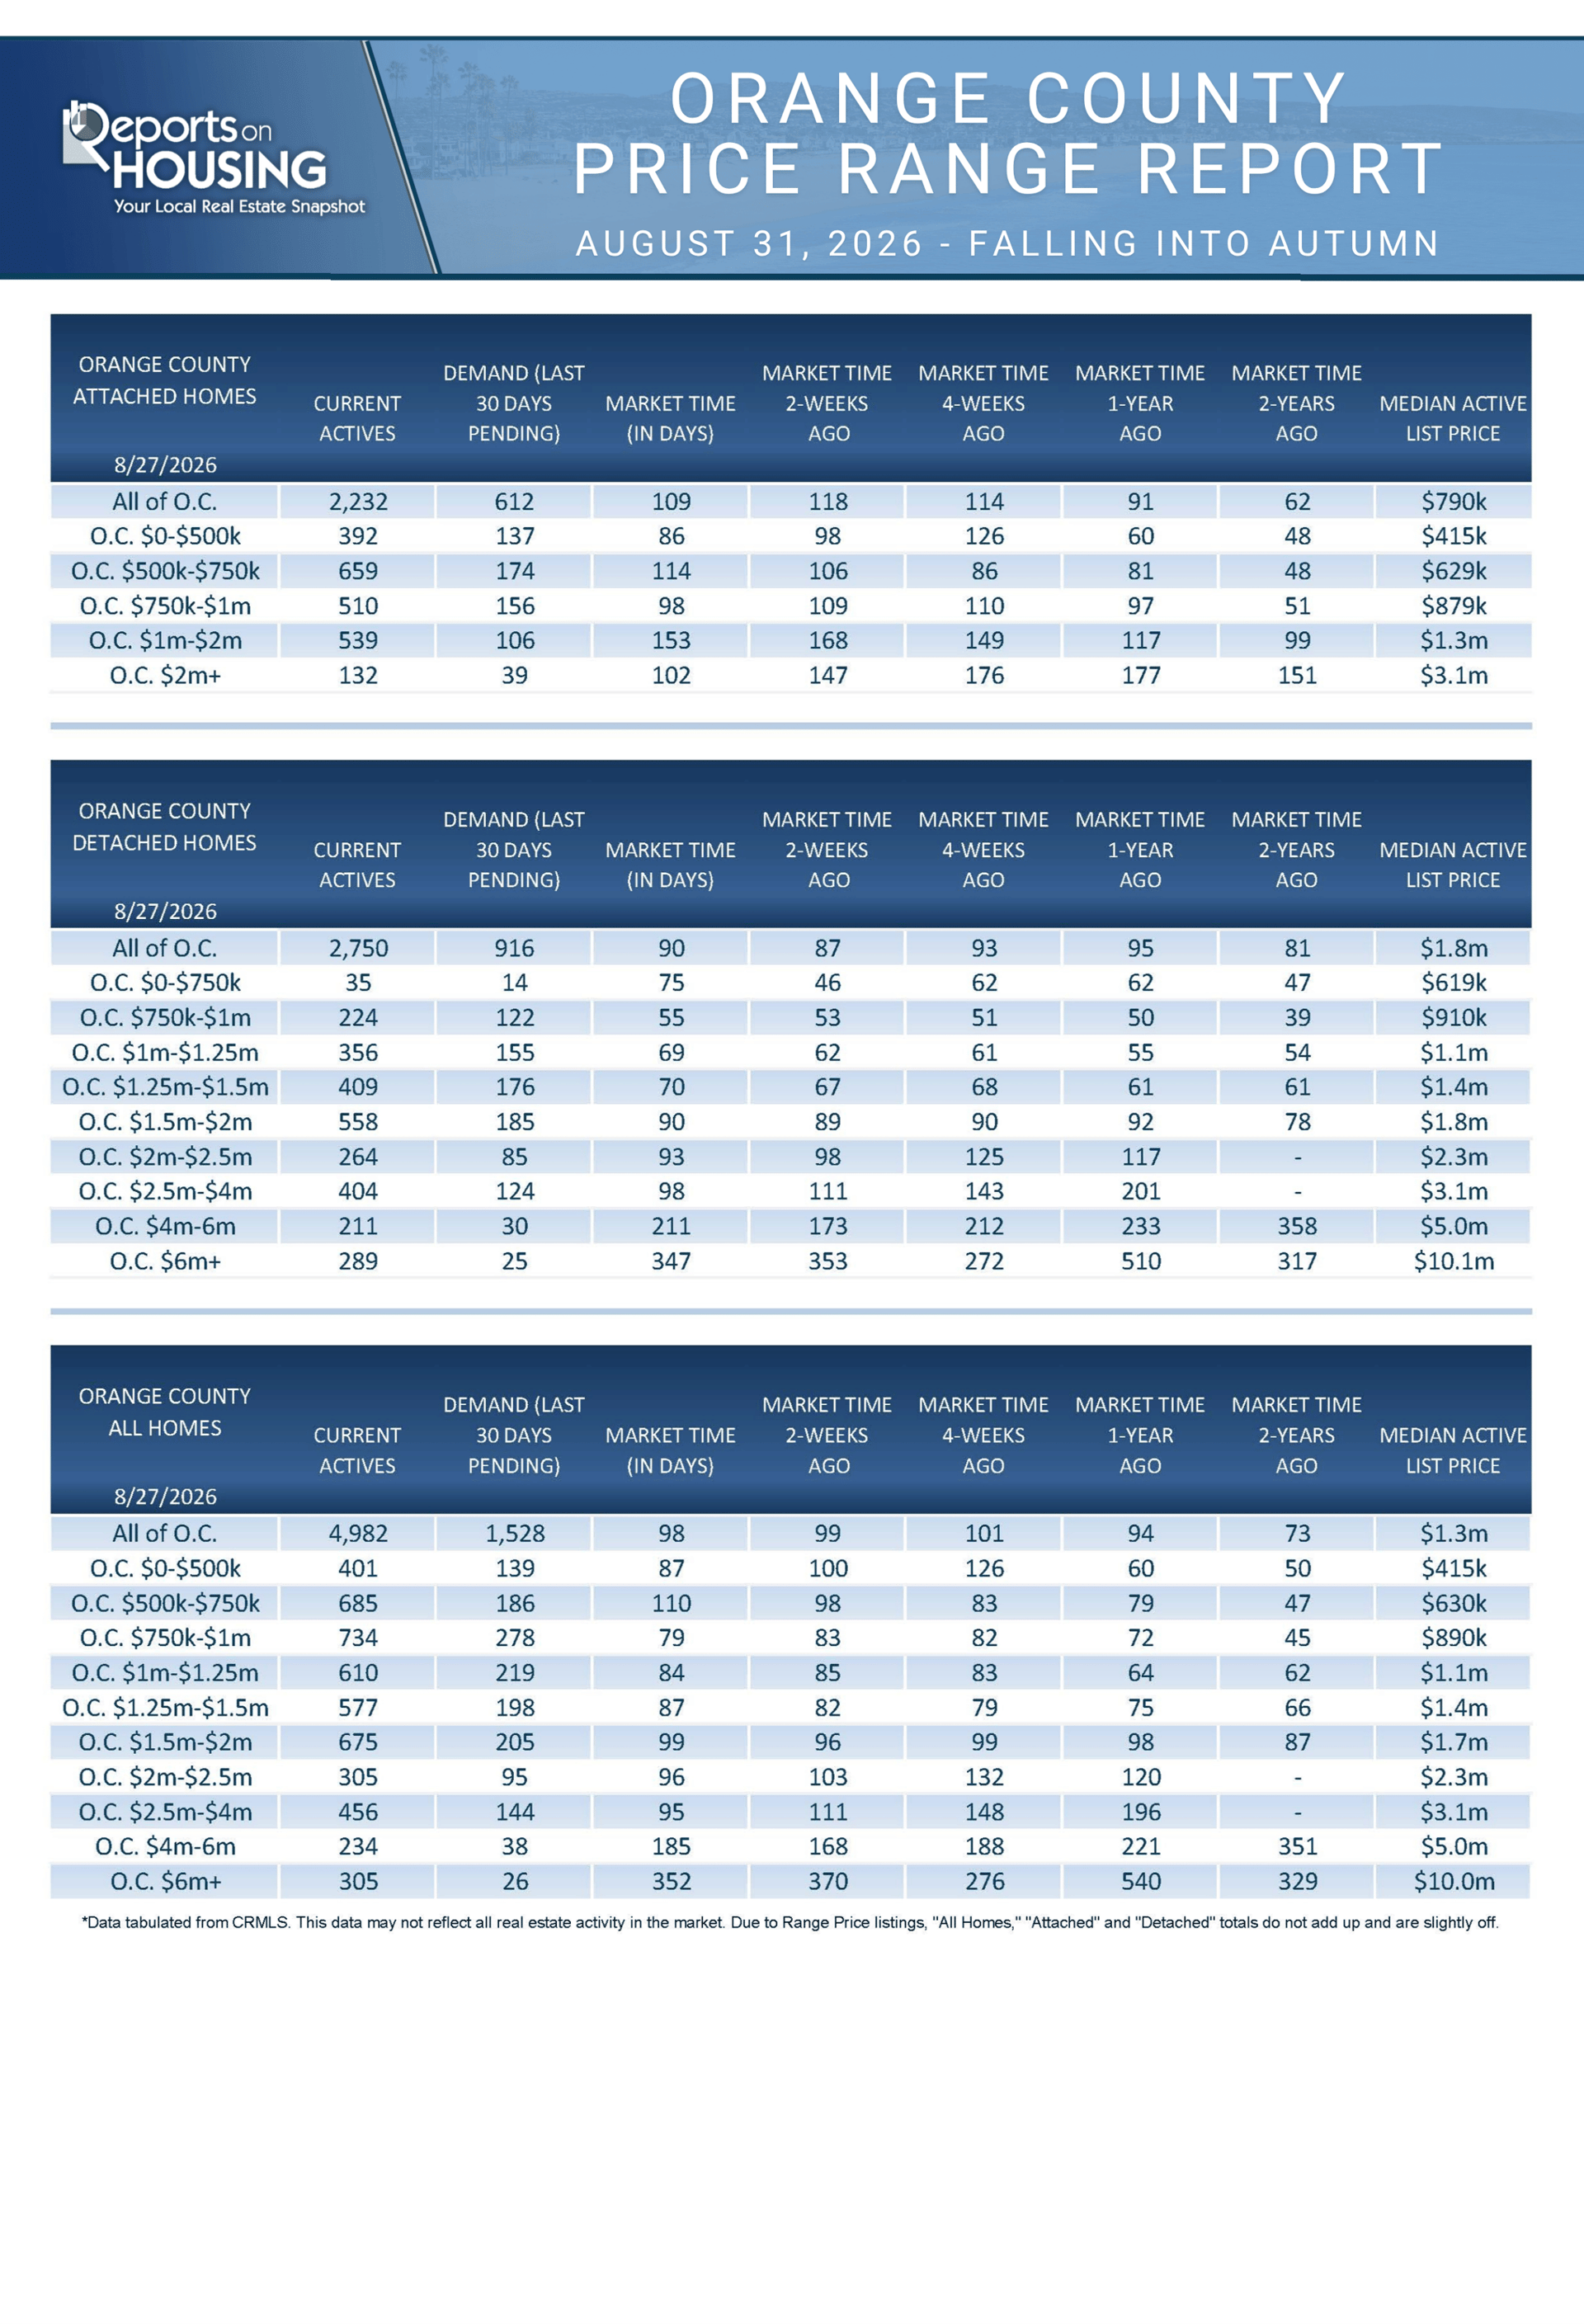
The Expected Market Time for condominiums and townhomes decreased from 118 to 109 days in the past two weeks. It was 91 days last year. For detached homes, the Expected Market Time increased from 87 to 90 days. It was 95 days a year ago. The detached-home market remains significantly faster than the attached-home market.
Luxury End
The luxury market improved over the past couple of weeks.
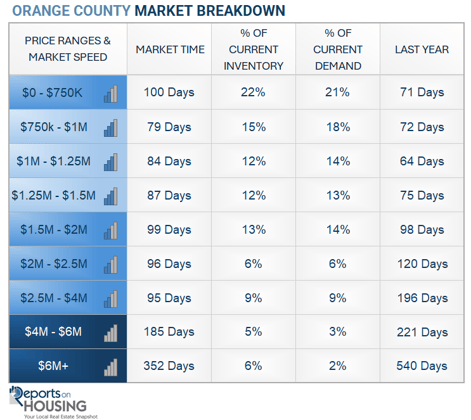
In the past couple of weeks, the luxury inventory of homes priced above $2.5 million (the top 10% of the Orange County housing market) decreased from 1,019 to 995, a drop of 24 (-2%). Luxury demand increased from 197 to 208 pending sales, up 11 (+6%). With supply falling and demand rising, the Expected Market Time for luxury homes priced above $2.5 million decreased from 155 to 144 days, its strongest reading of the year and its lowest level since February 2025.
Year over year, the active luxury inventory is down by 194 homes (-16%), and luxury demand is up by 64 pending sales (+44%). Last year’s Expected Market Time was 248 days, considerably slower than today.
In the past two weeks, the Expected Market Time for homes priced between $2.5 million and $4 million decreased from 111 to 95 days. For homes priced between $4 million and $6 million, the Expected Market Time increased from 168 to 185 days. For homes priced above $6 million, the Expected Market Time decreased from 370 to 352 days. Luxury is at 144 days overall. At this pace, a seller would be looking at becoming a pending sale around January 2027.
Orange County Housing Summary
- INVENTORY: The active listing inventory in the past couple of weeks decreased by 72 homes, and now stands at 4,982 (-1%). Last year, there were 4,869 homes on the market, 113 fewer homes (-2%). The 3-year average before COVID (2017 to 2019) was 6,569, which is 32% higher. From January through July, 27% fewer homes came on the market than the 3-year average before COVID (2017 to 2019), 6,899 fewer. There were 572 fewer than last year, 1,896 more than in 2024, and 4,332 more than in 2023.
- DEMAND: Buyer demand, the number of pending sales over the prior month, decreased by seven in the past two weeks and now stands at 1,528, nearly unchanged. Last year, there were 1,559 pending sales, up 2%. The 3-year average before COVID (2017 to 2019) was 2,438, which is 60% higher than today.
- MARKET TIME: With the inventory falling and demand nearly unchanged, the Expected Market Time, the number of days to sell all Orange County listings at the current buying pace, decreased from 99 to 98 days in the past couple of weeks. Last year, it was 94 days, similar to today. The 3-year average before COVID (2017-2019) was 82 days, faster than today.
- LUXURY: In the past two weeks, the Expected Market Time for homes priced between $2.5 million and $4 million decreased from 111 to 95 days. For homes priced between $4 million and $6 million, the Expected Market Time increased from 168 to 185 days. For homes priced above $6 million, the Expected Market Time decreased from 370 to 352 days.
- DISTRESSED HOMES: Short sales and foreclosures combined comprised only 0.2% of all listings and 0.5% of demand. Four foreclosures and seven short sales are available today in Orange County, bringing the total of distressed homes on the active market to 11, up two from two weeks ago. Last year, 7 distressed homes were on the market, similar to today.
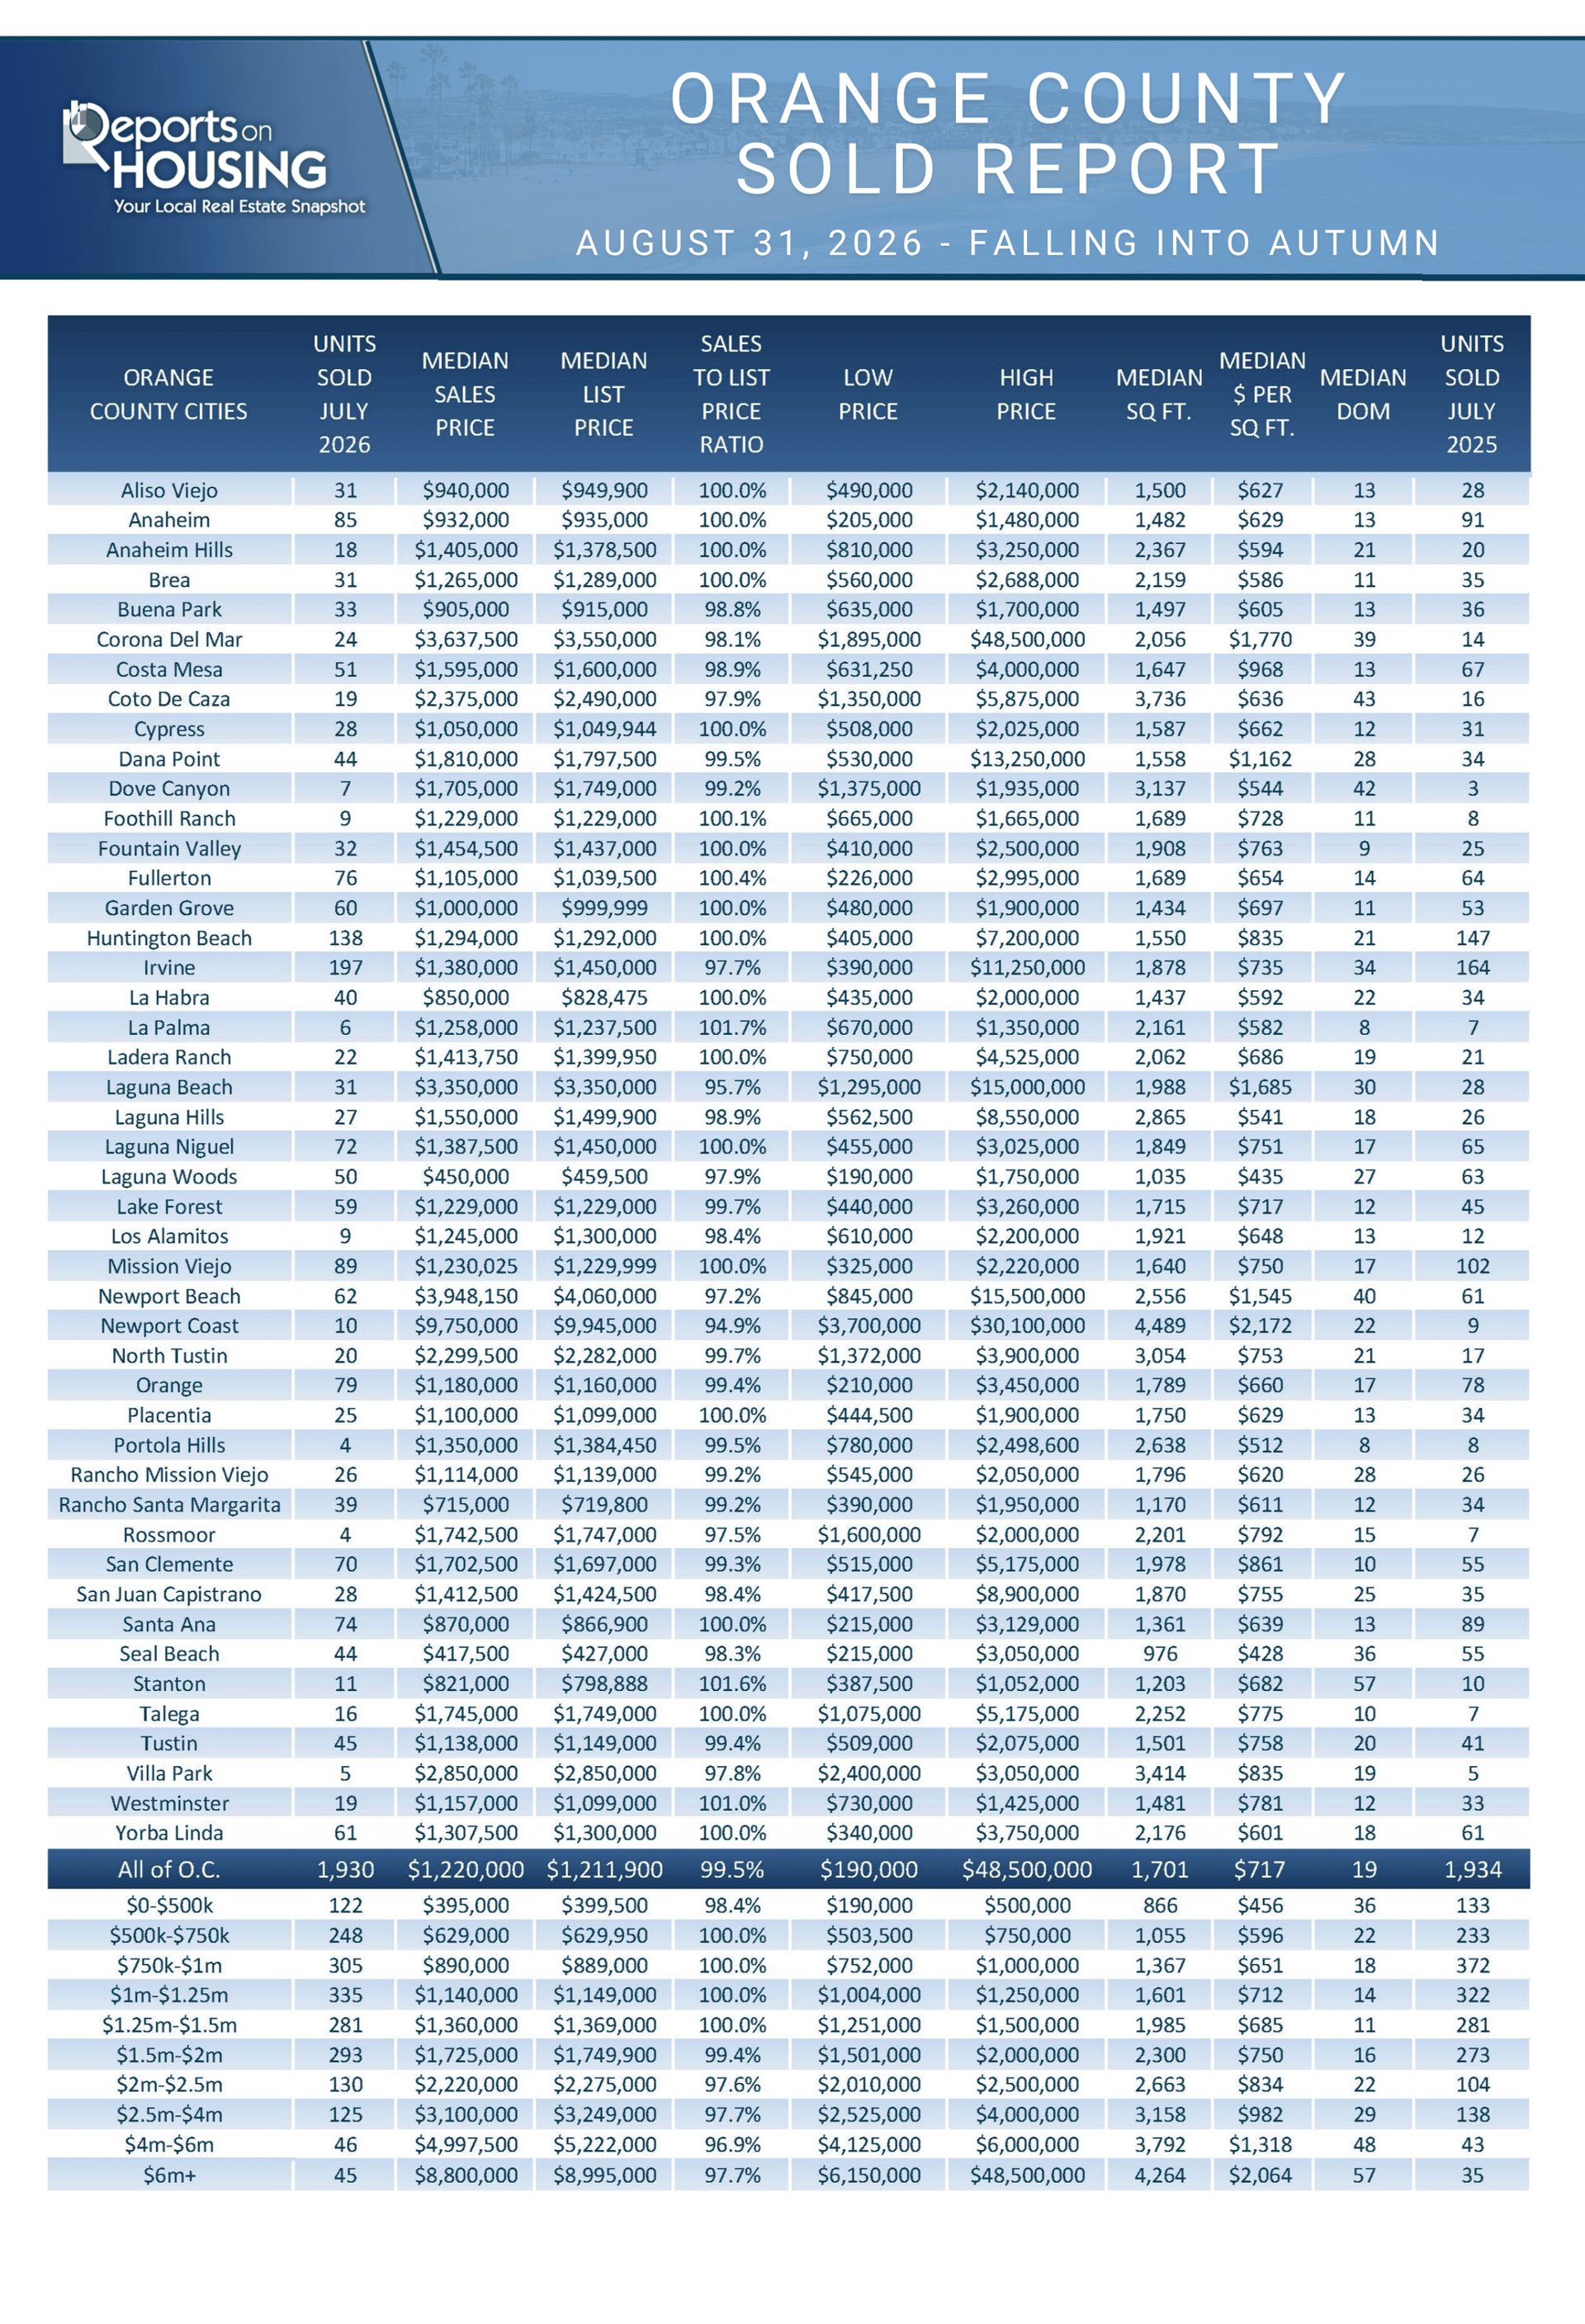
- CLOSED SALES: There were 1,930 closed residential resales in July, nearly identical to July 2025’s 1,934 sales, and down 3% from June 2026. The sales-to-list price ratio in Orange County was 99.5%. Foreclosures accounted for 0.05% of all closed sales, and short sales accounted for 0.05%. That means that 99.9% of all sales were sellers with equity.
This article is written by Steven Thomas.