Housing has slowed from a 42-day Expected Market Time in May to 66 days today, a much more favorable market speed for buyers.
Traveling down the freeway with the cruise control set to 75 miles per hour, listening to a favorite music playlist on Spotify, and the A/C set to the perfect temperature is easy, relaxing driving. Seemingly, there is nothing in the way of arriving at your destination with plenty of time to spare. Yet, the GPS navigation app exclaims that there is a 20-minute traffic delay ahead. After breaking and turning off the cruise control, the stop-and-go of snarling traffic takes over. Looking for an alternative route proves futile. It is time to grin and bear it. It will just take longer to arrive at your destination.
That is precisely how it feels to be a seller. The market was moving at a much swifter pace back in the spring. Sellers were cruising down the housing highway. That is just not the case today. It has significantly slowed. The Orange County housing market has shifted from a hot seller’s market to a much more balanced one. Buyers are getting a much-needed breather.
To better understand today’s market, comparing this year to where housing was one year ago is helpful. The active inventory currently sits at 3,371 homes versus 2,389 last year. That is up 982 homes or 41%. Every price range has a much stronger supply. Last year, housing was plagued by a scarcity of available homes to purchase. The most substantial issue affecting inventory is that homeowners are “hunkering down” in their homes and are unwilling to move due to their current underlying, locked-in, low fixed-rate mortgage. In 2023, through June, there were 12,346 homes placed on the market, down 44% or 9,794 missing FOR-SALE signs compared to the 3-year pre-COVID average (2017 to 2019) of 22,140 homes. This year, there were 14,252 homes placed on the market. While it is off by 36% compared to the 3-year pre-COVID average, it is up an additional 1,906 homes compared to last year.

The extra FOR-SALE signs are matched against buyer’s demand, which has been very similar to 2023 levels. In some weeks, demand has been slightly better than last year, and in others, it has been slightly down. Today, demand, a snapshot of the number of new pending sales over the prior month, is at 1,531 pending sales versus 1,598 last year, down 4% or 67 fewer pending sales. Not much of a difference compared to the contrast in supply. The hottest price range, homes priced between $750,000 and $1 million, has seen the most extensive cooldown compared to last year's demand.
The excess year-over-year supply and similar demand have resulted in much longer market times. Homes are sitting on the market a lot longer with increased seller competition. The Expected Market Time today (the number of days it takes to sell all Orange County listings at the current buying pace) is 66 days, up 21 compared to last year’s 45-day level. That is a noticeable difference in the marketplace. As a result, there are a lot more price reductions. A revealing 30% of all available homes have reduced their asking price at least once. This has been growing as the market has continued to cool.
Today’s housing market is much different than last year. With more choices in every price range, the sense of urgency for buyers has dissipated. Not as many homes are snapped up the moment the FOR-SALE sign is pounded into the ground. There are vastly more open houses to tour on the weekends. Home values are no longer skyrocketing higher.
Additionally, the purchasing power has greatly improved as mortgage rates have dropped from 7.5% in April to nearly 6.75% today. For example, a buyer looking for a $5,000 monthly payment (principal and interest) was looking at an $893,750 home in April. Today, they can look up to $963,750, an improvement of $70,000 in purchasing power. As rates drop, buyers can afford a larger home with no change in payment. The further rates fall, the larger the home. Of course, as rates drop more down the road, demand will grow.
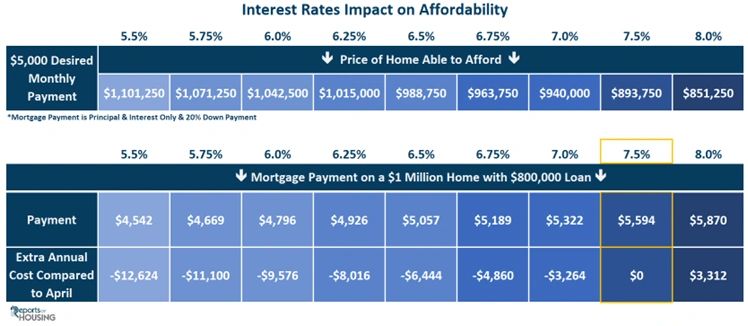
Another way to look at it is the annual savings for specifically priced homes as rates drop. For example, the monthly payment of a $1 million home with 20% down at 7.5% in April would be $5,594. At 6.75% today, it would be $5,189 per month, a savings of $4,860 annually. The lower rates drop, the larger the cumulative savings.
The bottom line: The Orange County housing market has seen a buyer-friendly shift. It is the best summer housing market for buyers since 2022, when rates were escalating. For sellers, it is imperative that they painstakingly arrive at the asking price with the expectation that today’s market is not instant for most.
The active inventory jumped 10% higher in the past couple of weeks.
The active listing inventory increased by 319 homes in the past two weeks, up 10%, and now sits at 3,371, its highest level since November 2022. It was the most significant rise of the year by far. Generally, at this time of year, the inventory rises at a much slower pace, but not this year. Strangely, it comes on the heels of easing mortgage rates, which is a much better environment to be a buyer. If rates continue to ease over the coming weeks, expect demand to rise and the inventory to reach its cyclical summer peak between July and August. From there, the inventory will slowly fall through the Autumn Market and pick up speed during the holiday season.
Last year, the inventory was 2,389 homes, 29% lower, or 982 fewer. The 3-year average before COVID (2017 through 2019) was 6,776, an additional 3,405 homes, or 101% more, a little more than double the current level.

Homeowners continue to “hunker down” in their homes, a phenomenon that became a crisis once rates skyrocketed higher in 2022. For June, 2,538 new sellers entered the market in Orange County, 1,323 fewer than the 3-year average before COVID (2017 to 2019), 34% less. Last June, there were 2,284 new sellers, 10% fewer than this year. More sellers are opting to sell compared to the previous year.
Demand dropped by 6% in the past couple of weeks.
Demand, a snapshot of the number of new pending sales over the prior month, decreased from 1,624 to 1,531 in the past couple of weeks, down 93 pending sales, or 6%, its lowest level since February. Demand continues to resemble last year’s levels closely. This will most likely change as the year progresses. Last year, from the end of July through mid-December, rates remained above 7% and even eclipsed 8% in mid-October. Yet, this year is lining up to be completely different. With the labor market and inflation cooling, the Federal Reserve is poised to cut the short-term Federal Funds rate starting in September. According to Mortgage News Daily, long-term, 30-year mortgages have already responded by dropping from 7.5% in April to 6.89% today. As unemployment continues to rise along with a softening labor market and easing inflation, rates will only fall further from here. With lower rates, more buyers will qualify, and buyer’s purchasing power will improve, paving the way for increased demand.
As the Federal Reserve has indicated, watching all economic releases for signs of slowing is essential. These releases can potentially move mortgage rates higher or lower, depending on how they stack up compared to market expectations. The Personal Consumption Expenditures – Price Index (PCE), the Fed’s preferred inflation gauge, will be released on Friday. Next week, the Federal Reserve meets and will conduct a news conference on Wednesday, ultimately revealing their appetite to cut rates in the near future, a crucial day for mortgage rates.
Last year, demand was 1,598, 4% more than today, or 67 additional pending sales. The 3-year average before COVID (2017 to 2019) was 2,578 pending sales, 68% more than today, or an additional 1,047.

With supply skyrocketing and demand falling, the Expected Market Time (the number of days it takes to sell all Orange County listings at the current buying pace) jumped from 56 to 66 days in the past couple of weeks. Last year, it was 45 days, faster than today. The 3-year average before COVID was 80 days, slower than today.
The luxury market slowed in the past couple of weeks.
In the past couple of weeks, the luxury inventory of homes priced above $2 million increased from 1,130 to 1,188 homes, up 58 or 5%, the highest level since October 2019. Luxury demand decreased by four pending sales, down 2%, and now sits at 226. With supply rising and demand falling, the Expected Market Time for luxury homes priced above $2 million increased from 147 to 158 days, its highest level since January. The luxury market feels exceptionally sluggish compared to the lower ranges. The higher the price, the longer it takes to secure success.

Year over year, the active luxury inventory is up by 373 homes or 46%, and luxury demand is up by 27 pending sales or 14%. Last year’s Expected Market Time was 123 days, much faster than today.
In the past two weeks, the expected market time for homes priced between $2 million and $4 million increased from 109 to 116 days. For homes priced between $4 million and $6 million, the Expected Market Time increased from 148 to 156 days. For homes priced above $6 million, the Expected Market Time increased from 557 to 630 days. At 630 days, a seller would be looking at placing their home into escrow around April 2026.
· The active listing inventory in the past couple of weeks jumped by 319 homes, up 10%, and now sits at 3,371, its highest level since November 2022. It was the largest two-week climb so far this year. In June, 34% fewer homes came on the market compared to the 3-year average before COVID (2017 to 2019), 1,323 less. Yet, 254 more sellers came on the market this June compared to June 2023. Last year, there were 2,389 homes on the market, 982 fewer homes, or 29% less. The 3-year average before COVID (2017 to 2019) was 6,776, or 101% extra, a little more than double.
· Demand, the number of pending sales over the prior month, decreased by 93 pending sales in the past two weeks, down 6%, and now totals 1,531, its lowest level since February. Last year, there were 1,598 pending sales, 4% more. The 3-year average before COVID (2017 to 2019) was 2,578, or 68% more.
· With supply climbing fast and demand falling, the Expected Market Time, the number of days to sell all Orange County listings at the current buying pace, jumped from 56 to 66 days in the past couple of weeks. It was 45 days last year, faster than today. The 3-year average before COVID (2017 to 2019) was 80 days, slower than today.
· In the past two weeks, the Expected Market Time for homes priced below $750,000 increased from 44 to 47 days. This range represents 17% of the active inventory and 23% of demand.
· The Expected Market Time for homes priced between $750,000 and $1 million increased from 35 to 46 days. This range represents 14% of the active inventory and 20% of demand.
· The Expected Market Time for homes priced between $1 million and $1.25 million increased from 42 to 46 days. This range represents 10% of the active inventory and 14% of demand.
· The Expected Market Time for homes priced between $1.25 million and $1.5 million increased from 39 to 52 days. This range represents 11% of the active inventory and 13% of demand.
· The Expected Market Time for homes priced between $1.5 million and $2 million increased from 49 to 65 days. This range represents 14% of the active inventory and 14% of demand.
· In the past two weeks, the expected market time for homes priced between $2 million and $4 million increased from 109 to 116 days. For homes priced between $4 million and $6 million, the Expected Market Time increased from 148 to 156 days. For homes priced above $6 million, the Expected Market Time increased from 557 to 630 days.
· The luxury end, all homes above $2 million, account for 35% of the inventory and 15% of demand.
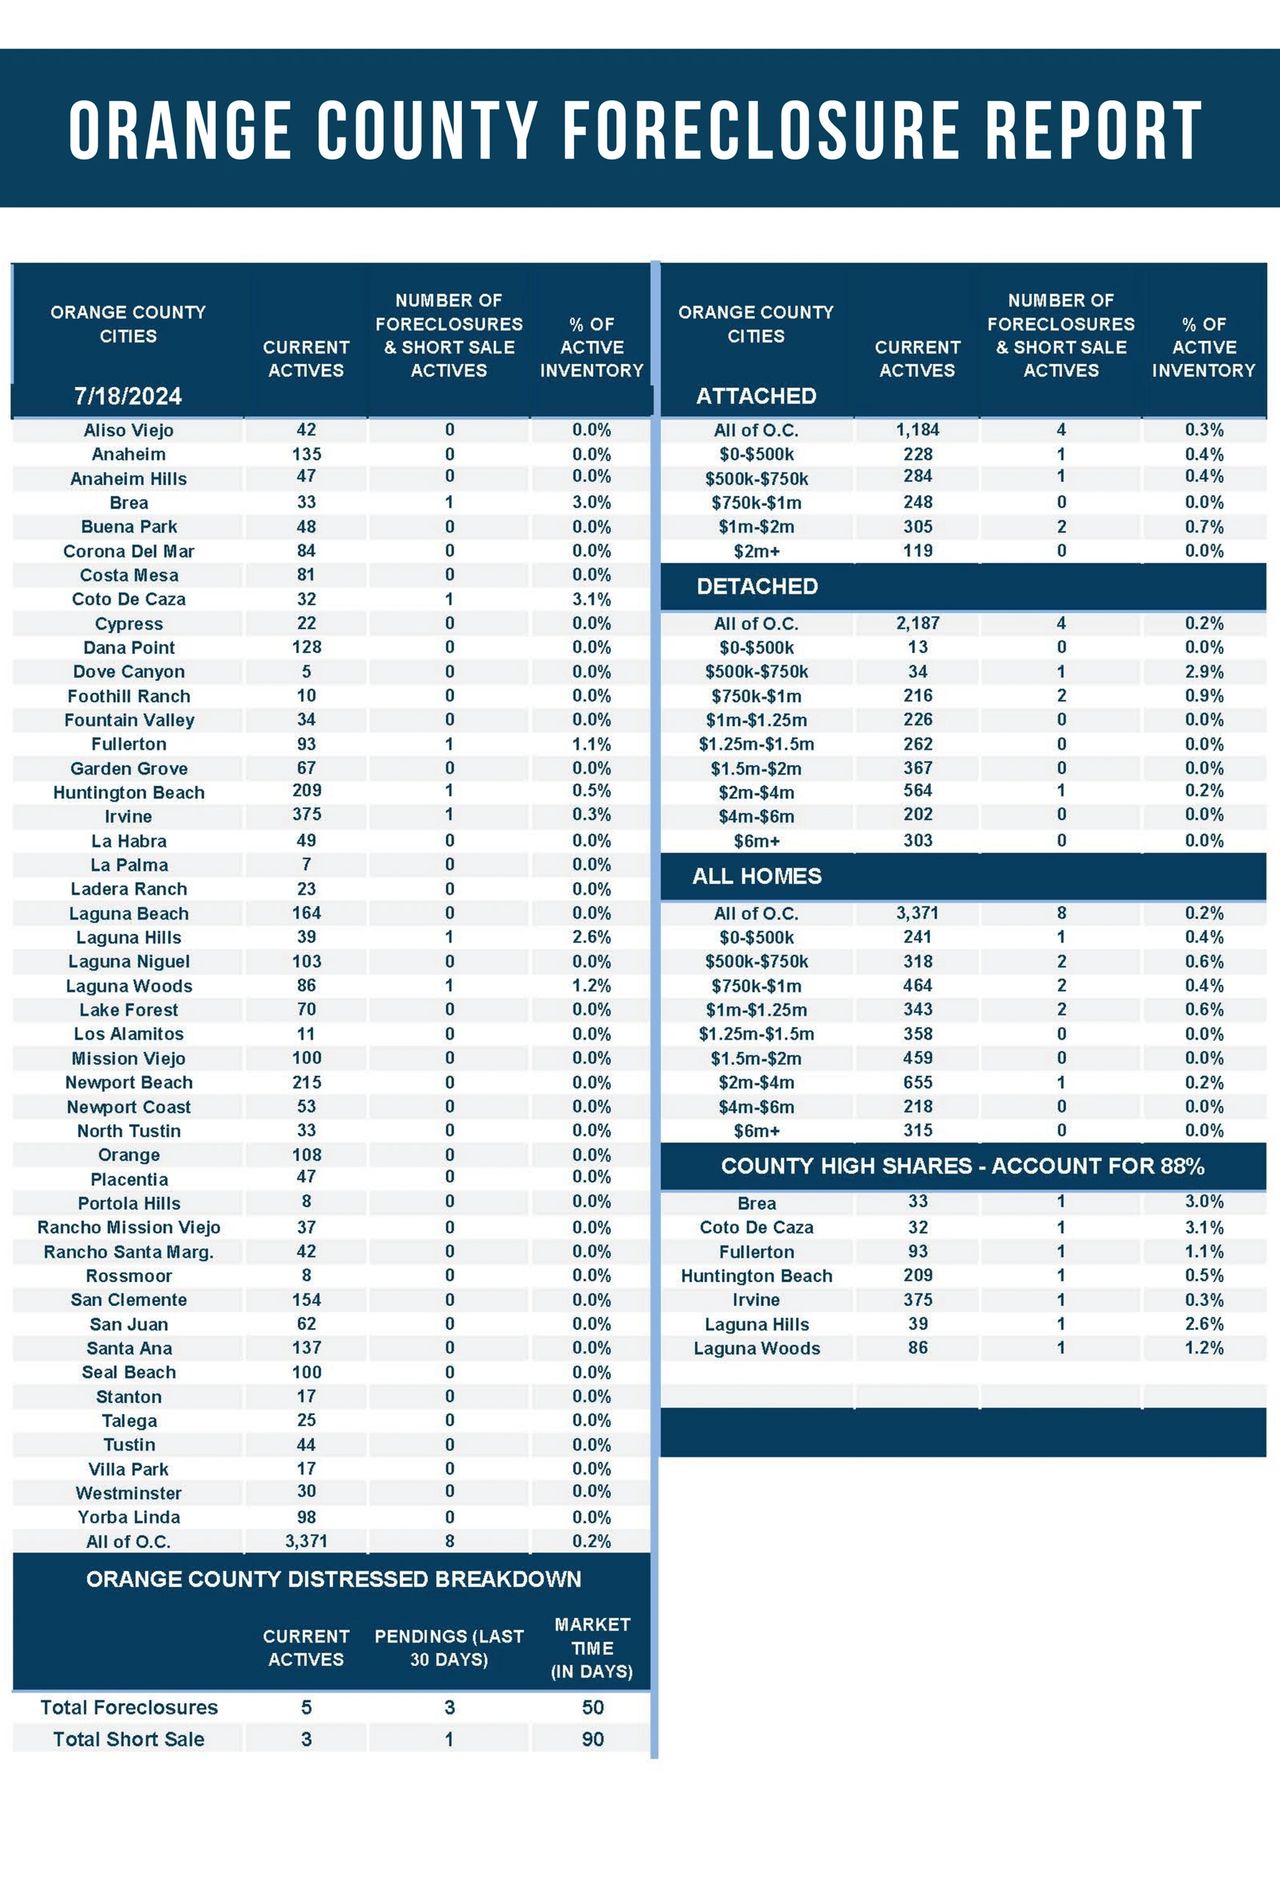
· Distressed homes, both short sales and foreclosures combined, comprised only 0.2% of all listings and 0.3% of demand. Only five foreclosures and three short sales are available today in Orange County, with eight total distressed homes on the active market, up one from two weeks ago. Last year, nine distressed homes were on the market, similar to today.
· There were 1,809 closed residential resales in June, down 9% compared to June 2023’s 1,993 and down 15% from May 2024. The sales-to-list price ratio was 100.3% for Orange County. Short sales accounted for 0.1% of all closed sales and no foreclosures. That means that 99.89% of all sales were good ol’ fashioned sellers with equity.