
Potential buyers have been listening to plenty of negative social media channels that have been steering unsuspecting consumers in the wrong direction.
Facts and Data
Ignore all the consistently negative social media channels and stick to the facts and data.
Negativity sells. The overabundant doom and gloom real estate headlines obtain a lot of attention. There is a plethora of YouTube, TikTok, Instagram, and X (formerly Twitter) channels devoted to pushing negative narratives about the real estate market. From bubbles to crashes to foreclosure waves to the coming collapse in home prices, the same storylines are pushed on a weekly, monthly, and yearly basis. These channels rack up hundreds of thousands of views, steering countless consumers in the wrong direction for years now. These prognosticators lack any economic credentials, and they have been preying on everyone who has been unable to or missed their opportunity to purchase over the years. Many would-be first-time home buyers have been rooting for a collapse in housing so that they, too, can finally obtain their piece of the American Dream.
It is hard to sit on the sidelines and watch housing prices skyrocket at an alarming pace from 2020 through the first half of 2022 in the midst of a once-a-century pandemic that temporarily shut down the economy. Home values reversed course for the second half of 2022 as mortgage rates ballooned higher, yet prices have been on the rise ever since. The dream of owning for many has been out of reach. As a result, the negative narratives blossomed. It is challenging to sift through all the headlines to determine what is true and what is fiction. Yet, the answer is straightforward in examining all the facts. It is time to bust through the myths that have developed about housing.
MYTH—Housing is in a bubble and about to crash. This could not be further from the truth. When home values plunge, as they did during the Great Recession, it is important to consider supply, demand, and the overall health of the housing stock. The U.S. total housing inventory averaged 2.2 million homes from 1996 through 2005. In 2006, prior to the Great Financial Crisis, it eclipsed 4 million homes and remained elevated for five years. The glut of available homes was matched with very weak demand, exasperated by job loss and an unemployment rate that surpassed 10% in 2009. There was a flood of forced sellers who were in a financial jam, unable to pay their monthly mortgage with no equity in their homes. Today, the U.S. total housing inventory is at 1.21 million homes, less than a third of where it was from 2006 through 2008. And today’s housing stock, all U.S. homeowners combined, has been built on strong credit, great jobs, low fixed payments (an excellent hedge against inflation and rising rents), record tappable equity (take out a second loan or cash-out refinance and still have 20% equity), record equity rich (over 50% equity in a home), and record owners who own their homes free and clear. Leading up to the Great Recession, the housing stock was made up of homeowners who purchased with very little or no down payments, low credit scores, subprime loans, pick-a-payment plans, teaser rate adjustable mortgages, fraudulent lending, and a flood of cash-out-refinances. Today’s chronically low inventory is matched up against weak demand, a much better balance than the bubble years of the Great Financial Crisis.
MYTH—Housing inventory is just as bad as last year.Economists and housing analysts consistently point out the lack of available homes to purchase, a depleted inventory with no hope of turning around. While it is true that there is a definitive scarcity of supply, a trend has emerged that sets the housing market apart from last year: the inventory is rising. The active listing inventory in Orange County has grown from 1,785 homes at the beginning of the year to 2,620 homes today, a rise of 47% or 835 homes. It is at its highest level since December 2020. Last year, it was at 2,190, which is 430 fewer homes or 16% less. It is still far from the inventory levels before the pandemic. The 3-year average before COVID (2017 to 2019) there were 6,370 homes at the end of May. That is 143% higher or 3,750 extra FOR-SALE signs. The U.S. inventory is at 1.21 million homes compared to 1.04 million last year, 170,000 fewer or 14% less. It is the highest level since October 2020. Yet, the 3-year average before COVID was at 1.85 million, 52% higher or an extra 640,000 homes. Nonetheless, the housing inventory is moving in the right direction. There are finally more homes for buyers to choose from, a step in the right direction for a housing market desperate to receive a fresh supply.

MYTH—When rates drop, prices will drop.Currently, the high mortgage rate environment is preventing many homeowners from selling. They are enjoying their low, fixed-rate monthly mortgage payments. According to the Federal Housing Finance Agency’s National Mortgage Database, 84% of all homeowners in California are locked in with a mortgage rate at or below 5%. As rates drop, it will entice more homeowners to sell their homes when the difference between their underlying mortgage rate and the rate of the day narrows. The thinking is that more sellers means the inventory of available homes will rise, ultimately leading to an oversupply of homes. The trouble with this argument is that when rates drop, buyers’ purchasing power improves dramatically. Lower rates allow a buyer to look at larger homes. For example, if a buyer desires a $5,000 per month principal and interest payment with 20% down, last October, when rates were at 8%, they were looking at an $851,250 home. Today, with rates close to 7%, it improves to a $940,000 home. If rates were to drop to 6%, they would be able to purchase a $1,042,500 home. When rates fall, it will open up a floodgate of demand, pent-up potential buyers who have been waiting on the sideline to purchase due to affordability constraints. With a drop in rates, the increase in demand will outpace the improvement in the number of homeowners willing to sell. Many will still opt to stay put and continue to enjoy their fixed low rates.

MYTH—With unemployment rising, there will be a lot more foreclosures. The unemployment rate has risen from a 50-year low of 3.4% in April 2023 to 3.9% in April this year. Yet, 3.9% is still a historically low rate. Even if unemployment were to continue to rise, it has a long way to go until it is problematic. From 1996 to 2006, it averaged 4.98%. That was before the start of the Great Recession when the economy was just chugging along. The foreclosure wave back then was built on easy credit, little to no down payments, and just about anyone could get a loan regardless of their ability to make their monthly obligation. When the housing market turned, many homeowners were underwater immediately with negative equity. In October 2008, there were 1,320 closed foreclosures and short sales in Orange County, 78% of closed sales. In April of this year, there were 1,968 total closed sales, yet only one was a foreclosure, and three were short sales, 0.2% of all sales. Today’s tight credit standards, insulating housing from a repeat of the Great Recession, can be traced back to the Dodd-Frank Act, a 2010 law in response to the Great Financial Crisis. It prevented excessive risk-taking on Wall Street and provided common-sense protections for consumers in obtaining a loan. The Orange County housing stock is strong and resilient, able to endure economic swings, including 2022's largest increase in rates since the 1980s.

The bottom line: ignore all the housing myths and social media channels devoted to negative narratives. Instead, stick to the facts and data. The data does not lie.
Active Listings
The active inventory climbed by 6% in the past couple of weeks.
The active listing inventory increased by 150 homes in the past two weeks, up 6%, and now sits at 2,620, its highest level since December 2022. It has been rising at its fastest pace since 2022, growing by 610 homes in the past eight weeks, up 30%. In 2022, it grew by 74% or 1,145 in the same eight weeks. The inventory will continue to grow until it peaks during the summer months between July and August. As soon as rates drop with a slowing economy, the inventory will have an issue rising, just like it did last year and in 2021.
Last year, the inventory was 2,190 homes, 16% lower, or 430 fewer. The 3-year average before COVID (2017 through 2019) was 6,370, an additional 3,750 homes, or 143% more, more than double the current level.
Homeowners continue to “hunker down” in their homes, unwilling to move due to their current underlying, locked-in, low fixed-rate mortgage. For April, 2,748 new sellers entered the market in Orange County, 1,272 fewer than the 3-year average before COVID (2017 to 2019), 32% less. Last April, there were 2,144 new sellers, 22% fewer than this year. More sellers are opting to sell compared to the previous year.
Demand
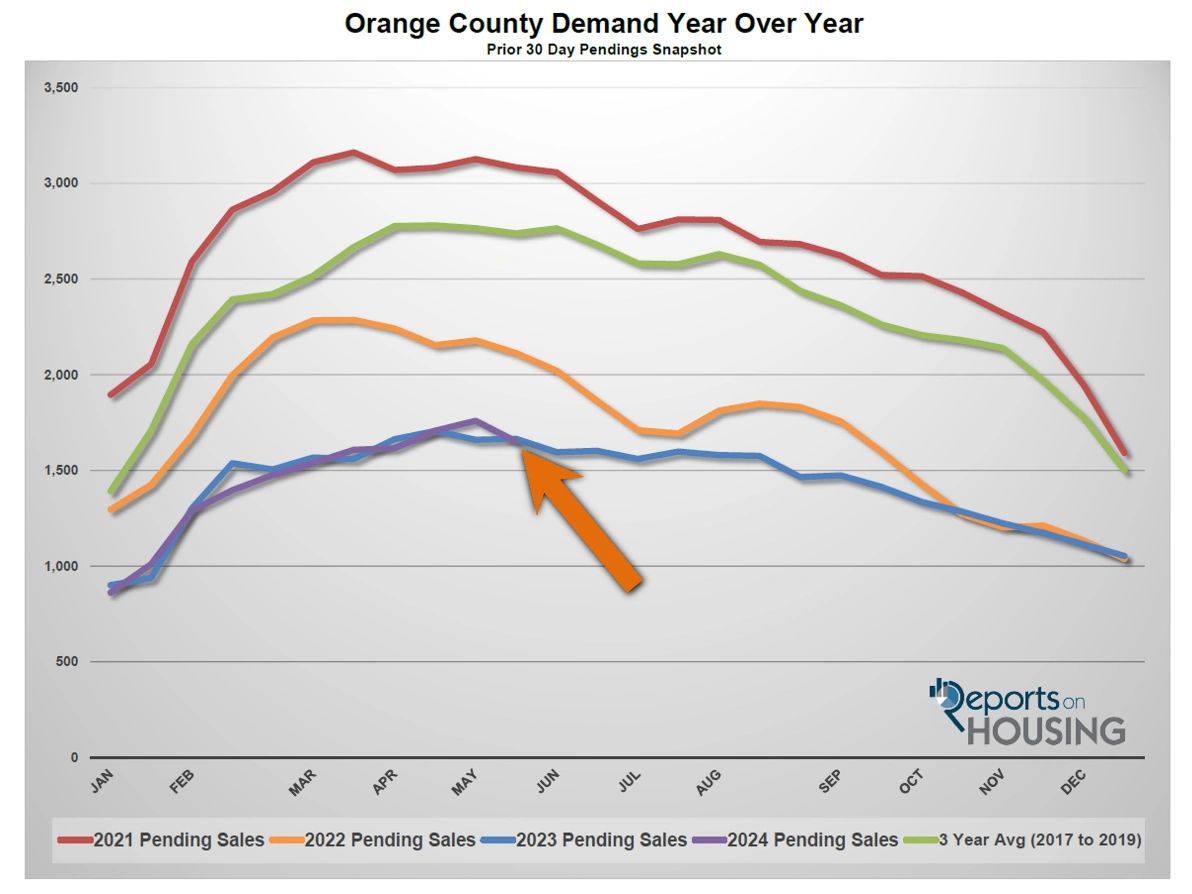
Demand dropped by 6% in the past couple of weeks.
Demand, a snapshot of the number of new pending sales over the prior month, decreased from 1,759 to 1,650 in the past couple of weeks, down 109 pending sales, or 6%, its largest drop of the year. Demand may have reached a peak for 2024 two weeks ago at 1,759. It could rise further if rates drop in the coming months due to cooling economic data. They are currently bouncing just above 7%, according to Mortgage News Daily. There are several economic releases over the coming week that could move rates significantly. Gross Domestic Product (GDP), 1st Quarter 2024 (second estimate) will be released on Thursday; Personal Consumption Expenditures (PCE), the Federal Reserve’s preferred inflation index, is on Friday. Next week is jobs week, which includes the number of job openings, wages, and the number of jobs created or lost.
Last year, demand was 1,665, 1% more than today, or 15 additional pending sales. The 3-year average before COVID (2017 to 2019) was 2,738 pending sales, 66% more than today, or an additional 1,088.
With supply rising and demand falling, the Expected Market Time (the number of days it takes to sell all Orange County listings at the current buying pace) increased from 42 to 48 days in the past couple of weeks. Last year, it was 39 days, faster than today. The 3-year average before COVID was 70 days, slower than today.
Luxury End
The luxury market cooled in the past week.
In the past couple of weeks, the luxury inventory of homes priced above $2 million increased from 935 to 971 homes, up 36 or 4%, the highest level since August 2020. Luxury demand decreased by 14 pending sales, down 5%, and now sits at 261. With supply rising and demand falling, the Expected Market Time for luxury homes priced above $2 million increased from 102 to 112 days, its highest level since February. The 112-day level is still hot for luxury. This is either a new trend of a slowing luxury market or is just a data blip that can reverse course quickly, only time will tell.
Year over year, the active luxury inventory is up by 246 homes or 34%, and luxury demand is up by 61 pending sales or 31%. Last year’s Expected Market Time was 109 days, similar to today.
In the past two weeks, the expected market time for homes priced between $2 million and $4 million increased from 66 to 76 days. For homes priced between $4 million and $6 million, the Expected Market Time decreased from 167 to 154 days. For homes priced above $6 million, the Expected Market Time decreased from 413 to 384 days. At 384 days, a seller would be looking at placing their home into escrow around March 2025.
Orange County Housing Summary
· The active listing inventory in the past couple of weeks increased by 150 homes, up 6%, and now sits at 2,620. In April, 32% fewer homes came on the market compared to the 3-year average before COVID (2017 to 2019), 1,272 less. 604 more sellers came on the market this April compared to April 2023. Last year, there were 2,190 homes on the market, 430 fewer homes, or 16% less. The 3-year average before COVID (2017 to 2019) was 6,370, or 143% extra, more than double.
· Demand, the number of pending sales over the prior month, decreased by 109 pending sales in the past two weeks, down 6%, and now totals 1,650. Last year, there were 1,665 pending sales, 1% more. The 3-year average before COVID (2017 to 2019) was 2,738, or 66% more.
· With supply rising and demand falling, the Expected Market Time, the number of days to sell all Orange County listings at the current buying pace, increased from 42 to 48 days in the past couple of weeks. It was 39 days last year, faster than today. The 3-year average before COVID (2017 to 2019) was 70 days, slower than today.
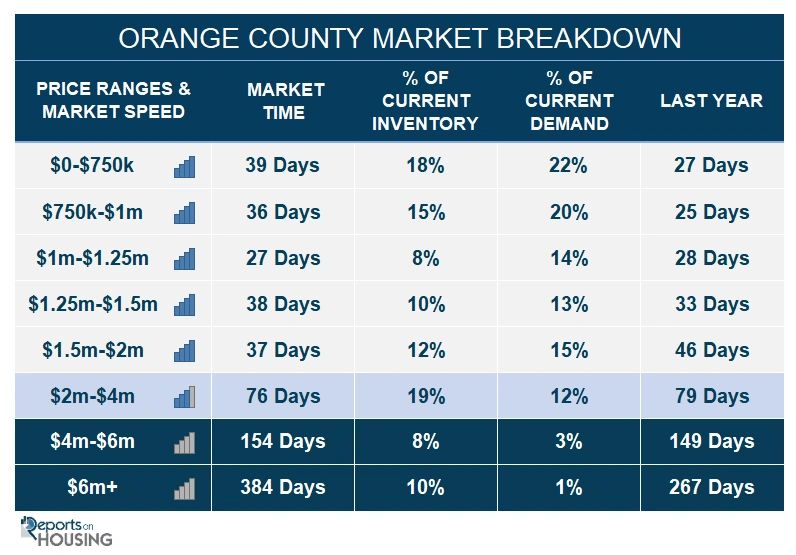
· In the past two weeks, the Expected Market Time for homes priced below $750,000 increased from 31 to 39 days. This range represents 18% of the active inventory and 22% of demand.
· The Expected Market Time for homes priced between $750,000 and $1 million increased from 23 to 36 days. This range represents 15% of the active inventory and 20% of demand.
· The Expected Market Time for homes priced between $1 million and $1.25 million decreased from 28 to 27 days. This range represents 8% of the active inventory and 14% of demand.
· The Expected Market Time for homes priced between $1.25 million and $1.5 million increased from 28 to 38 days. This range represents 10% of the active inventory and 13% of demand.
· The Expected Market Time for homes priced between $1.5 million and $2 million decreased from 46 to 37 days. This range represents 12% of the active inventory and 15% of demand.
· In the past two weeks, the expected market time for homes priced between $2 million and $4 million increased from 66 to 76 days. For homes priced between $4 million and $6 million, the Expected Market Time decreased from 167 to 154 days. For homes priced above $6 million, the Expected Market Time decreased from 413 to 384 days.
· The luxury end, all homes above $2 million, account for 37% of the inventory and 16% of demand.
· Distressed homes, both short sales and foreclosures combined, comprised only 0.2% of all listings and 0.2% of demand. Only five foreclosures and one short sale are available today in Orange County, with six total distressed homes on the active market, up one from two weeks ago. Last year, 14 distressed homes were on the market, similar to today.
· There were 1,968 closed residential resales in April, up 16% compared to April 2023’s 1,696, and up 10% from March 2024. The sales-to-list price ratio was 100.4% for Orange County. Foreclosures accounted for 0.05% of all closed sales, and short sales accounted for 0.15%. That means that 99.8% of all sales were good ol’ fashioned sellers with equity.


Share this post: