Despite mortgage rates eclipsing 7%, there are very few available homes, multiple offers are the norm, and home values are on the rise.
As the economy eventually cools, mortgage rates will drop, fueling demand and leading to an even hotter housing market.
Many potential buyers are sitting on the sidelines, waiting for the market to become more affordable. Combining high home values and significantly higher mortgage rates, the expectation was for home values to plunge. Home affordability has collapsed due to rates rising from 3.25% in January 2022 to 7% today. Purchasing a home is out of reach for so many Americans. The logic is simple: either incomes rise substantially, interest rates significantly fall, or home values tumble. They believe that the only proper solution is for home values to collapse.
Yet, the housing market has proven to be exceedingly resilient despite higher rates and low home affordability. Incomes have not suddenly spiked, mortgage rates have not plunged, and home values have risen year over year. Housing has played out much differently than expected. Buyers new to the housing arena are shocked to find tremendous competition. Jam-packed open houses, multiple offer bidding wars, and sales prices at or above the asking prices are the norm, especially in the lower price ranges.
It is best to look at supply and demand to understand why home values have not collapsed. Before and during the Great Recession, there was a glut of homes available across the U.S. Before 1995, the inventory averaged 2,250,000 homes, according to the National Association of REALTORS® (1982 to 2005). From 2006 to 2010, it averaged 3,430,000, 52% higher, and even eclipsed 4,000,000 homes in July 2007. During the Great Recession, demand plunged. With a glut of homes available and very low demand, home values crashed. Yet, since 2021, the U.S. inventory has averaged 1,100,000. In January, it was at 1,010,000. There is a scarcity of homes available to purchase. With higher rates, demand has plunged once again. This time, low demand is matched up against a chronically low inventory. This has resulted in rising home values.
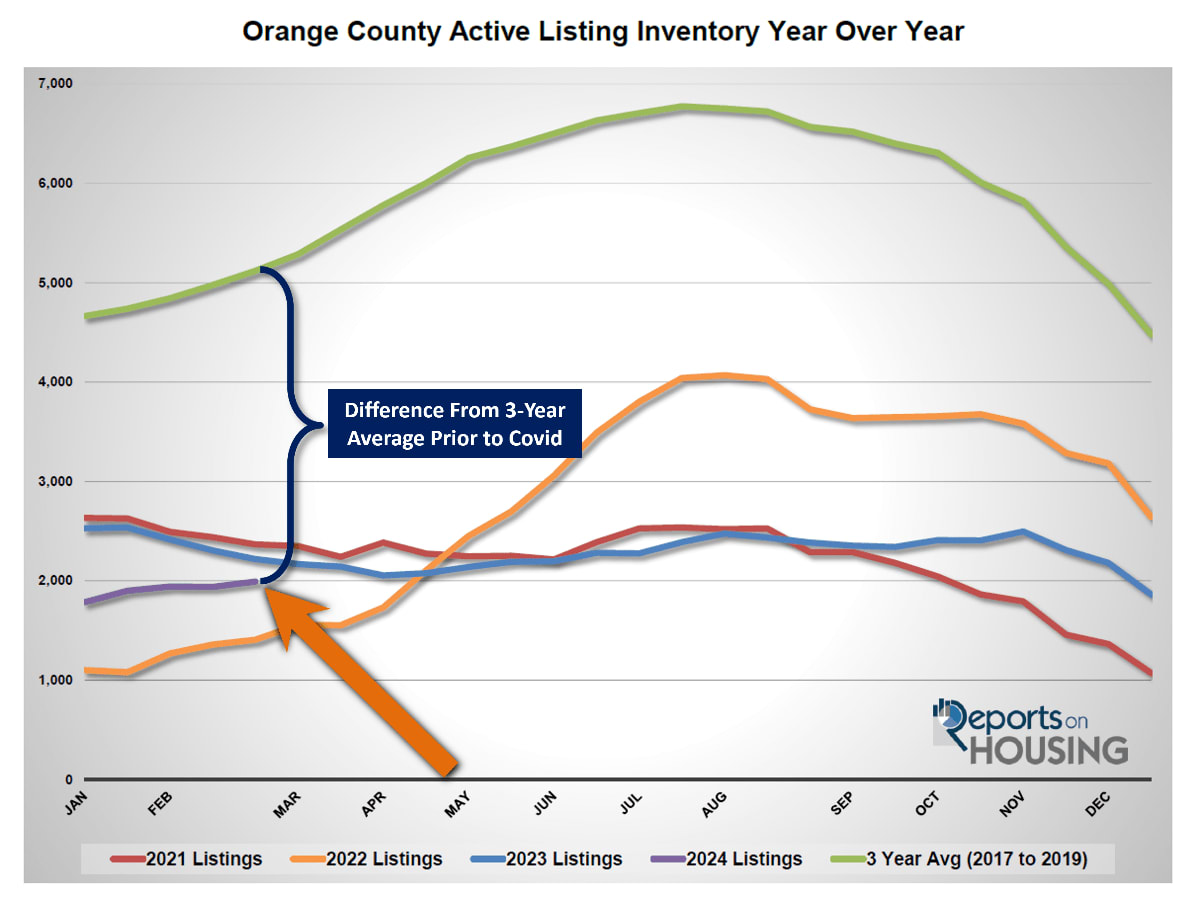
In Orange County, there are only 1,992 homes available to purchase today. The 3-year average before COVID (2017 to 2019) was 5,119, 157% higher than today, or an extra 3,127 homes. That is when housing was appreciating methodically from year to year. Home values continuously appreciated annually from 2012 through 2019. The housing market was not out of control, and the supply of available homes to purchase before COVID was at normal levels. On the other hand, today’s inventory is at chronically low, anemic levels.
Even with limited demand, the Orange County inventory has struggled to grow. The main culprit is the lack of homes coming on the market. When there are fewer FOR-SALE signs, it is challenging for homes to accumulate to grow inventory. In 2023, there were 42% fewer sellers than the 3-year average before COVID. That is over 16,000 missing signs. So far this year, through February, there are 36% fewer sellers or over 2,200 missing signs.
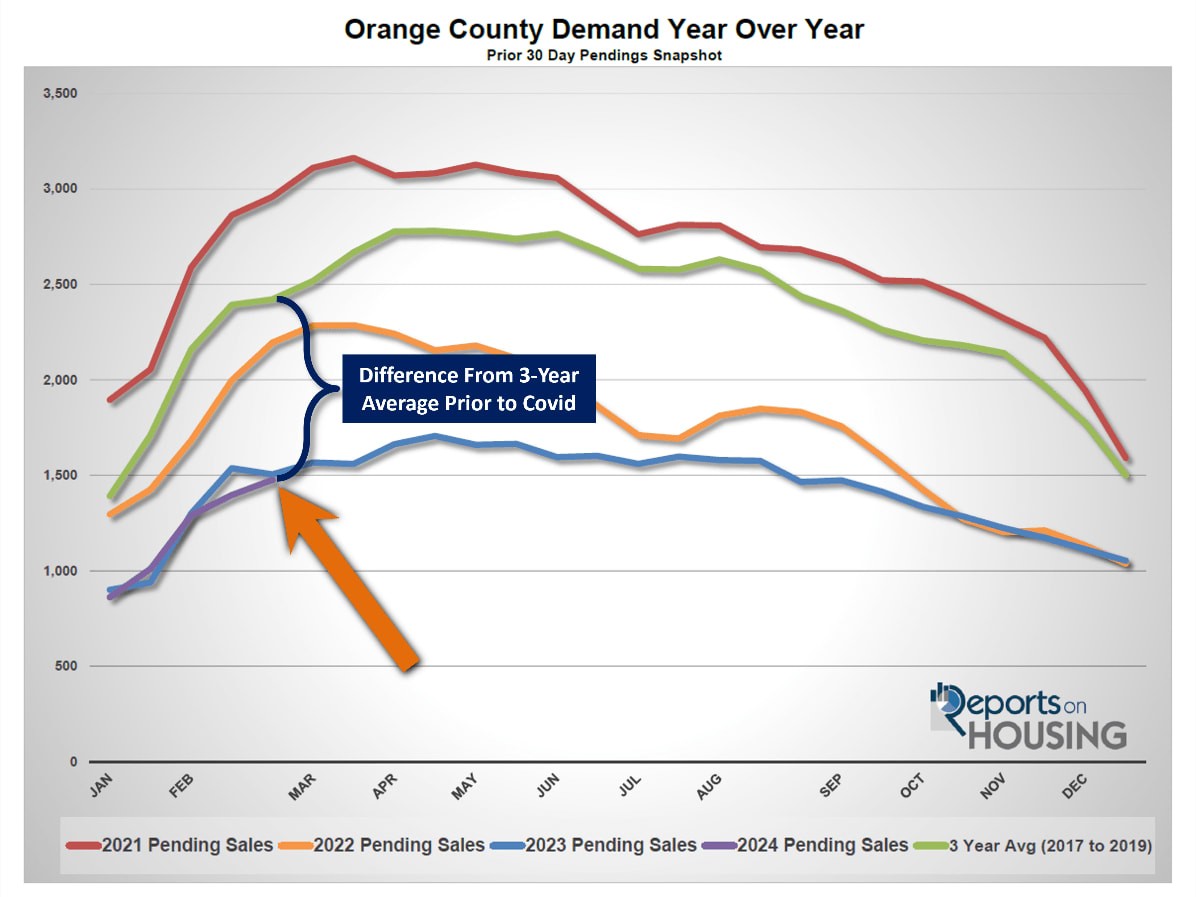
Orange County demand, a snapshot of the number of new pending sales over the prior month, has been exceedingly low. This is partly due to the lack of homes available in the lower price ranges. Today’s demand is at 1,476 pending sales, slightly less than last year’s 1,505 pending sales. The 3-year average before COVID was 2,422, 64% higher than today, or an extra 946 pending sales.
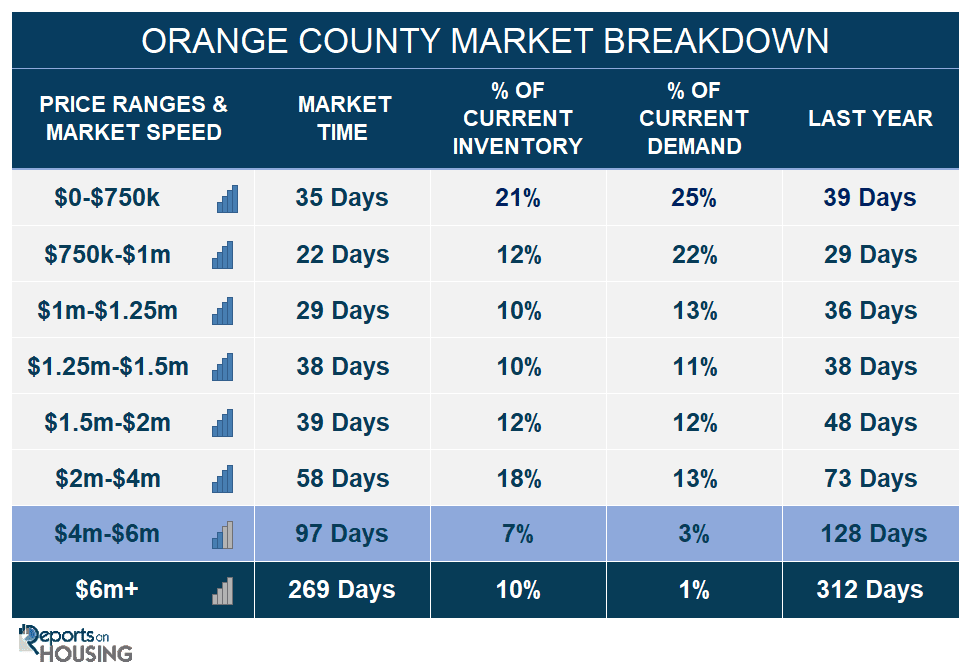
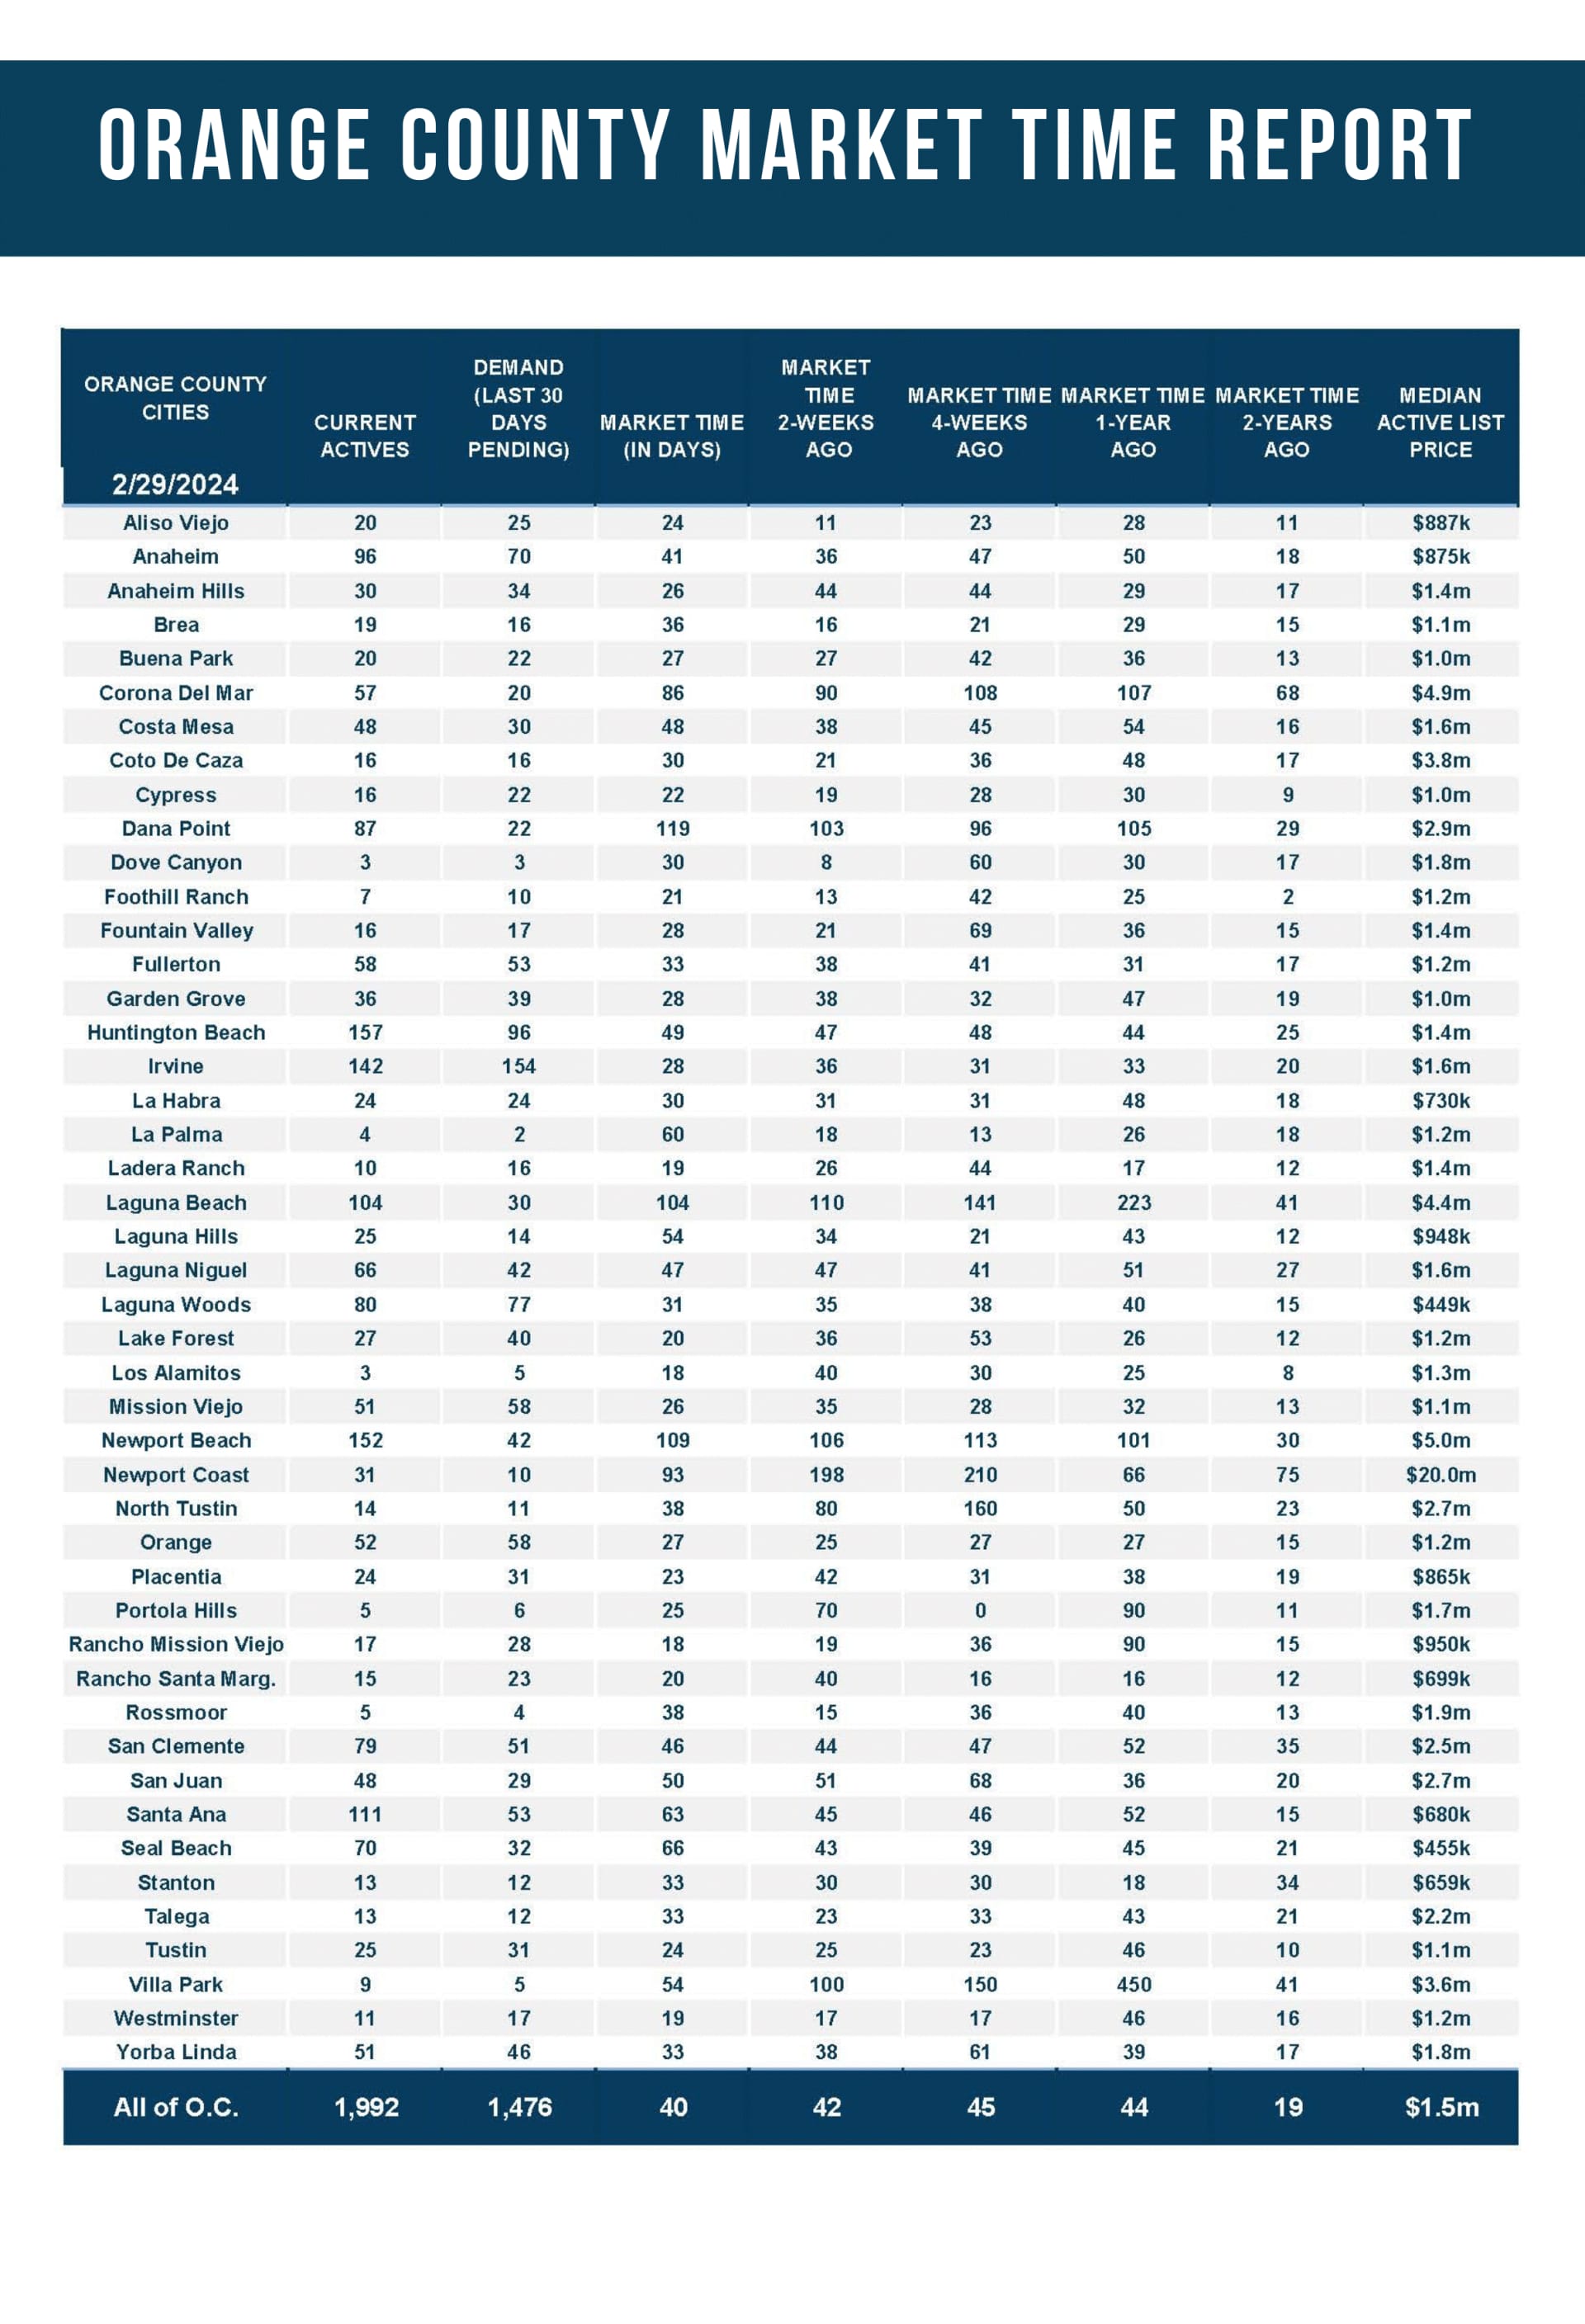
Low demand levels do not mean that the market is not exceptionally hot. Today’s Expected Market Time (the number of days to sell all Orange County listings at the current buying pace) is 40 days. At 40 days, buyers compete, bidding wars are the norm, and home values are rising. This occurs with a scarcity of supply, which is precisely what the housing market is experiencing today.
Why is right now a good time to buy rather than waiting for qualified buyers? Rates are expected to drop this year. In December, the Federal Reserve projected reducing the Federal Funds Rate three times this year. Their dual mandate is for both maximum employment and stable prices. The job market has been robust, and inflation is coming down nicely towards their 2% target. Despite plenty of positive numbers, the U.S. economy is facing many headwinds. Personal savings rates are low. Pandemic-era excess savings from government stimulus checks are running out. Credit card debt is growing at an abnormally fast rate. Credit card, automobile, and multi-family delinquencies have been rising rapidly. Eventually, the economy will slow from its current brisk pace. Most economists agree that a recession is not in the mix, but economic growth will slow. When this occurs, investors move their money to the safe haven of 10-year treasuries and mortgage-backed securities, resulting in a substantial drop in mortgage rates. At first, rates will drop between 6% to 6.5%. Eventually, if the economy remains cool with duration, rates could fall below 6% for the first time since August 2022.
Lower rates will result in an immediate boost in the number of buyers looking to purchase. Affordability will drastically improve. Demand readings will improve virtually overnight. Eventually, as rates drop, the number of homeowners willing to sell will increase. But remember, 85% of all California homeowners with a mortgage are enjoying a fixed rate at or below 5%. Not everyone will be inclined to trade their low rates for a higher one. The dramatic increase in demand will outpace the number of additional homeowners willing to sell. As a result of this mismatch, the housing market will get even hotter, the number of multiple offers will increase, bidding wars will get more fierce, and home values will rise.
It was true a year ago, and it is true today: The time is now. Buyers who wait will face increased competition, and purchasing a home will become even more challenging.
The active inventory increased by 3% in the past couple of weeks.
The active listing inventory decreased by 53 homes in the past two weeks, up 3%, and now sits at 1,992. As long as rates remain above 7%, the inventory will slowly grow. The Spring Housing market starts in just a couple of weeks, mid-March. More homeowners come on the market each month. More homes are placed on the market in May than in any other month. The second most occurs in April and the third most in March. Any rise in available homes will be a welcome relief to an inventory starved for fresh supply. Expect the inventory to slowly accumulate until peaking in the summer between July and August. The only caveat is that when the U.S. economy slows and mortgage rates fall, the inventory will have difficulty growing and may even decline early.
Last year, the inventory was 2,218 homes, 11% higher, or 226 more. The 3-year average before COVID (2017 through 2019) was 5,119, an additional 3,3,127 homes, or 157% extra, more than double where it stands today.
Homeowners continue to “hunker down” in their homes, unwilling to move due to their current underlying, locked-in, low fixed-rate mortgage. For February, 1,954 new sellers entered the market in Orange County, 1,178 fewer than the 3-year average before COVID (2017 to 2019), 38% less. Last February, there were 1,755 new sellers, 10% fewer than this year. More sellers are finally opting to sell compared to the previous year.
Demand increased by 6% in the past couple of weeks.
Demand, a snapshot of the number of new pending sales over the prior month, increased from 1,397 to 1,476 in the past couple of weeks, up 79 pending sales, or 6%, its highest level since August. Yet, it is the lowest end-of-February reading since tracking began in 2004. With more homes coming on the market during the Spring Market, just a couple of weeks away, expect demand to rise due to the increase in supply. It will not be a substantial rise because of the limitations of affordability. Typically, demand peaks between April and May. Yet, if rates drop later this year due to an economic slowdown, this year’s peak could come later.
Last year, demand was 1,505, 2% more than today, or 29 extra pending sales. The 3-year average before COVID (2017 to 2019) was 2,422 pending sales, 64% more than today, or an additional 946.
With demand rising faster than the rise in supply, the Expected Market Time (the number of days to sell all Orange County listings at the current buying pace) decreased from 42 to 40 days in the past couple of weeks, its lowest level since May. Last year, the Expected Market Time was 44 days, similar to today. The 3-year average before COVID was 64 days, slower than today.
The luxury market continued to improve in the past couple of weeks.
In the past couple of weeks, the luxury inventory of homes priced above $2 million increased from 681 to 706 homes, up 25, or 4%. Luxury demand jumped by 31 pending sales, up 14%, and now sits at 253, its highest level since April 2022. With demand surging higher compared to the smaller rise in supply, the Expected Market Time for luxury homes priced above $2 million dropped from 92 to 84 days, its lowest reading since May 2022. The luxury price ranges are heating up and are more resilient and stronger than last year. This is a very hot pace for the luxury market and is not typical.
Year over year, the active luxury inventory is up by 92 homes or 15%, and luxury demand is up by 76 pending sales or 43%. Last year’s Expected Market Time was 104 days, slower than today.
For homes priced between $2 million and $4 million, the Expected Market Time in the past two weeks decreased from 63 to 58 days. For homes priced between $4 million and $6 million, the Expected Market Time decreased from 136 to 97 days. For homes priced above $6 million, the Expected Market Time increased from 240 to 269 days. At 269 days, a seller would be looking at placing their home into escrow around November 2024.
• The active listing inventory in the past couple of weeks increased by 53 homes, up 3%, and now sits at 1,992. It is the second-lowest mid-February reading since tracking began in 2004, only behind 2022. In February, 38% fewer homes came on the market compared to the 3-year average before COVID (2017 to 2019), 1,178 less. 199 more sellers came on the market this February compared to 2023. Last year, there were 2,218 homes on the market, 226 more homes, or 11% higher. The 3-year average before COVID (2017 to 2019) was 5,119, or 157% extra, more than double.
• Demand, the number of pending sales over the prior month, increased by 79 pending sales in the past two weeks, up 6%, and now totals 1,476, the lowest end-of-February reading since tracking began. Last year, there were 1,505 pending sales, 2% more than today. The 3-year average before COVID (2017 to 2019) was 2,422, or 64% more.
• With demand rising faster than the rise in supply, the Expected Market Time, the number of days to sell all Orange County listings at the current buying pace, decreased from 42 to 40 days in the past couple of weeks. It was 44 days last year, similar to today. The 3-year average before COVID (2017 to 2019) was 64 days, slower than today.
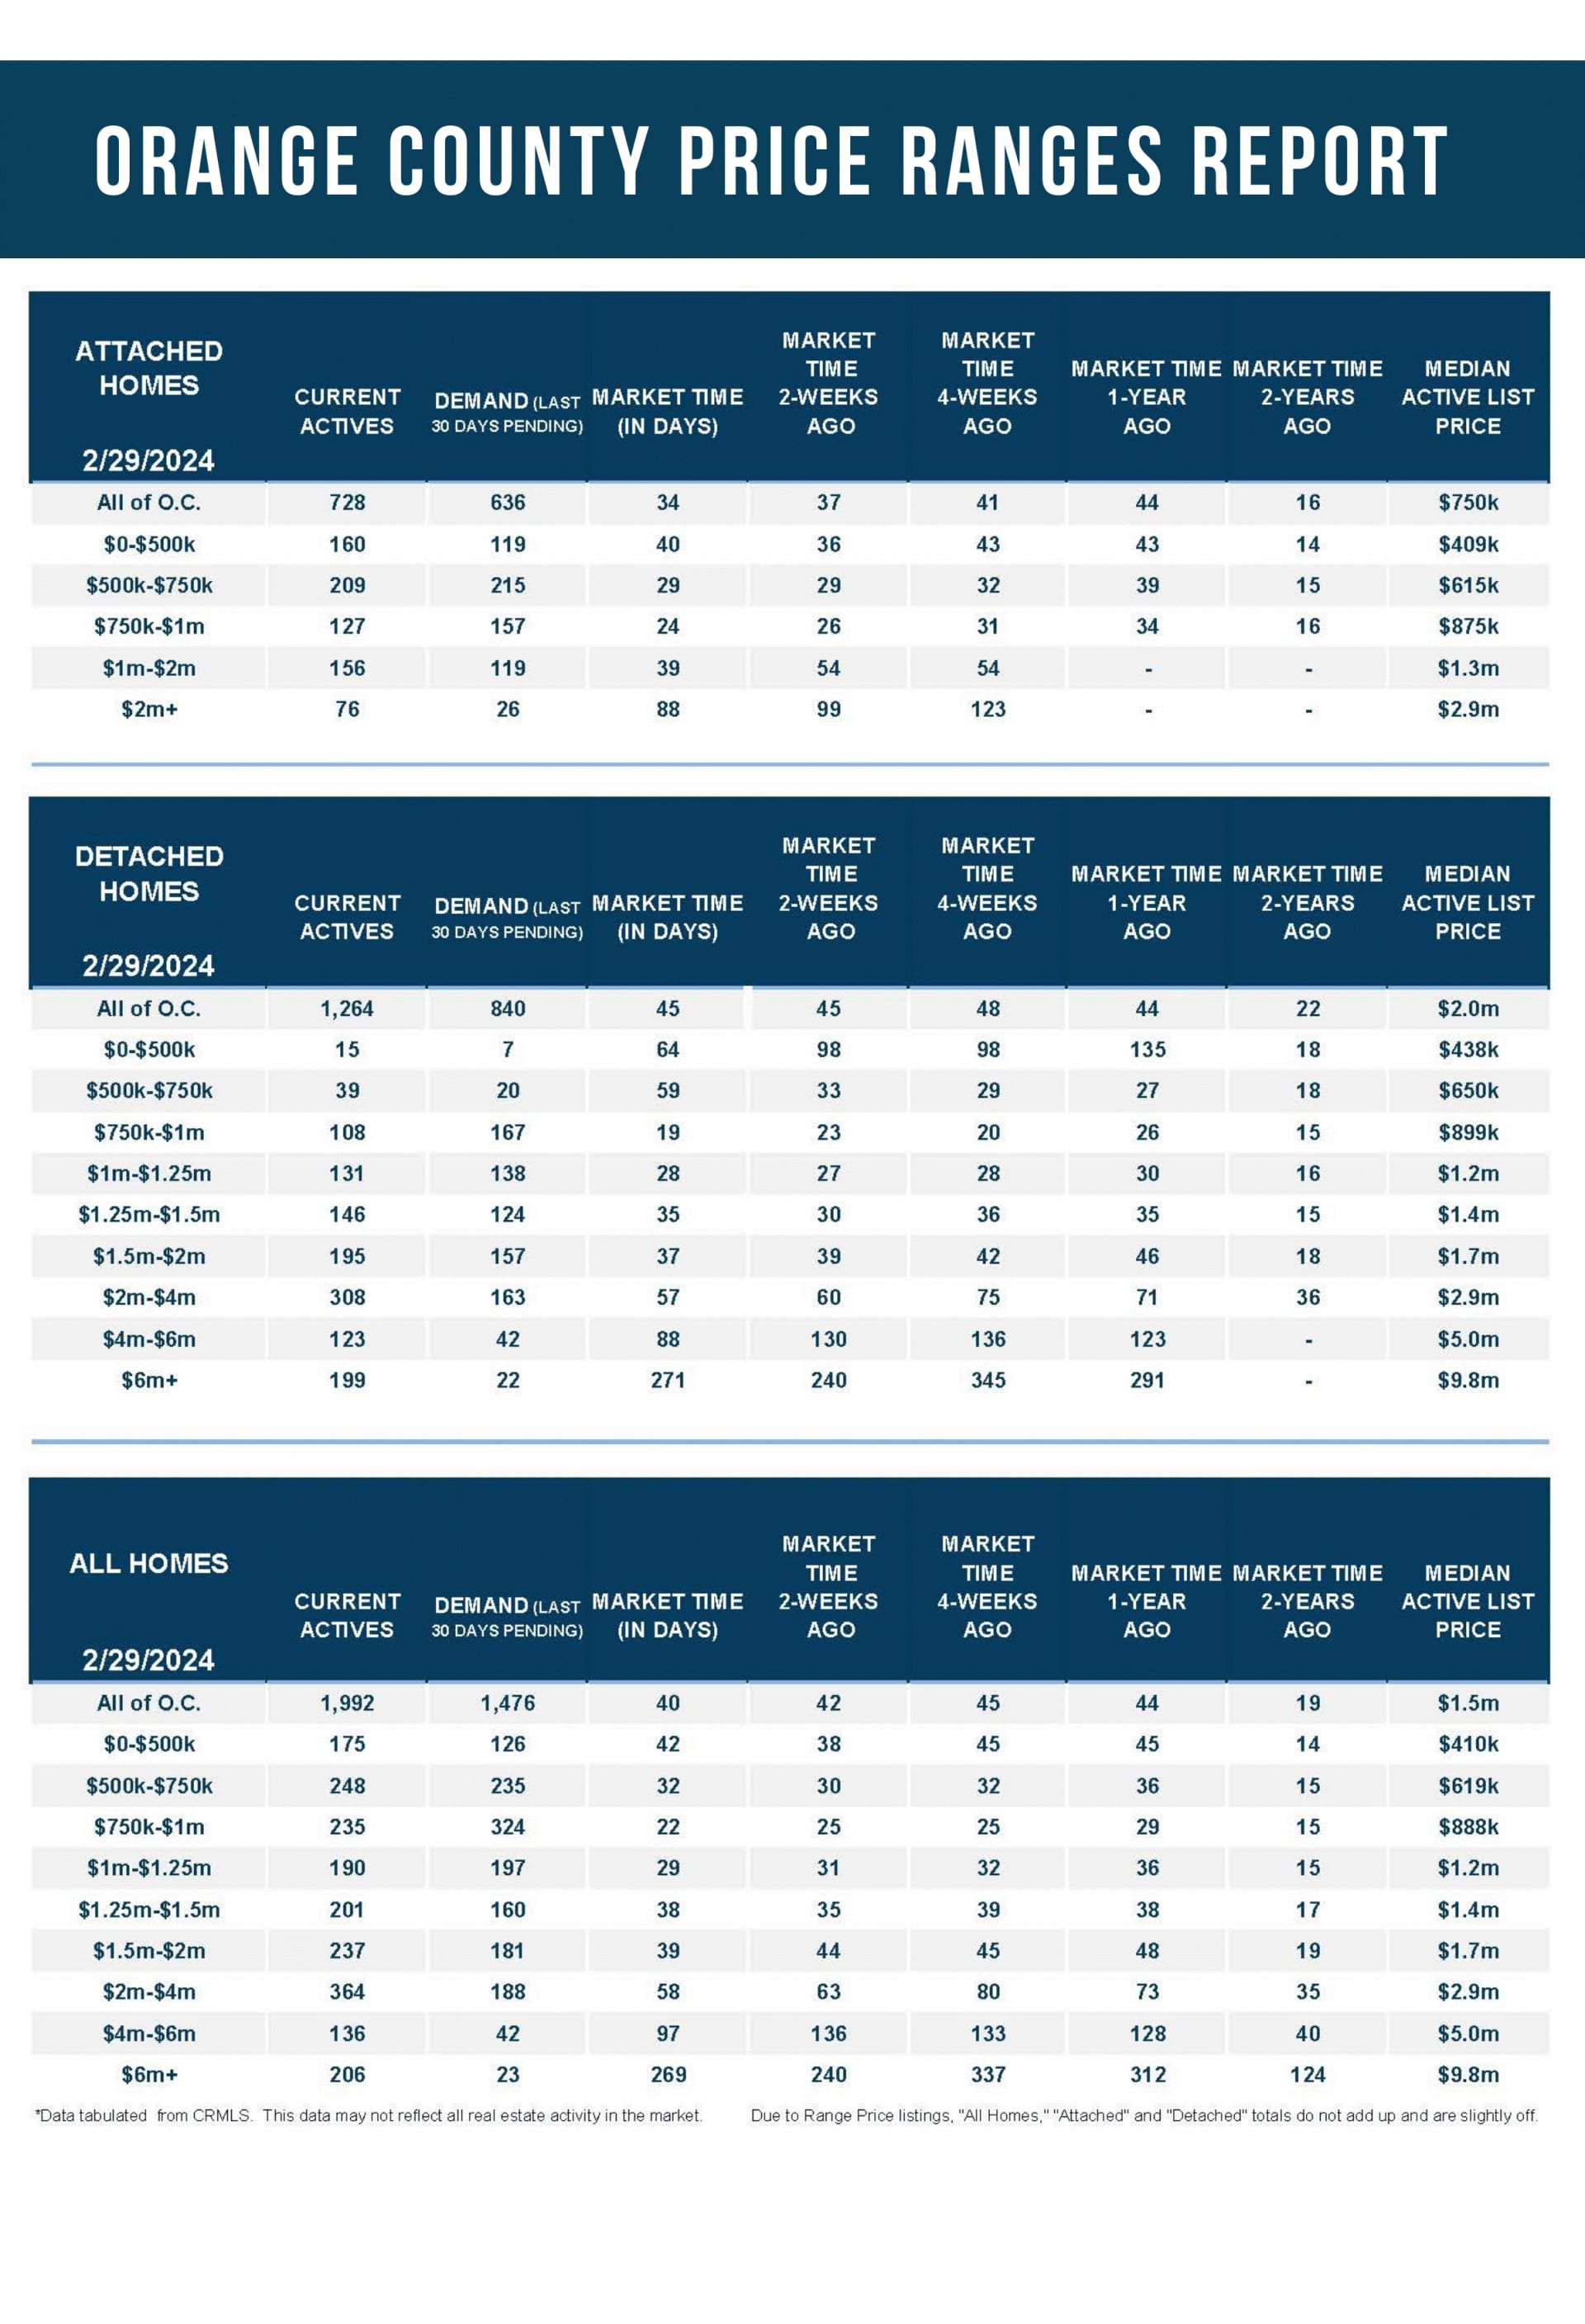
• For homes priced below $750,000, the Expected Market Time increased from 33 to 35 days. This range represents 21% of the active inventory and 25% of demand.
• For homes priced between $750,000 and $1 million, the Expected Market Time decreased from 25 to 22 days. This range represents 12% of the active inventory and 22% of demand.
• For homes priced between $1 million and $1.25 million, the Expected Market Time decreased from 31 to 29 days. This range represents 10% of the active inventory and 13% of demand.
• For homes priced between $1.25 million and $1.5 million, the Expected Market Time increased from 35 to 38 days. This range represents 10% of the active inventory and 11% of demand.
• For homes priced between $1.5 million and $2 million, the Expected Market Time decreased from 44 to 39 days. This range represents 12% of the active inventory and 12% of demand.
• For homes priced between $2 million and $4 million, the Expected Market Time in the past two weeks decreased from 63 to 58 days. For homes priced between $4 million and $6 million, the Expected Market Time decreased from 136 to 97 days. For homes priced above $6 million, the Expected Market Time increased from 240 to 269 days. At 269 days, a seller would be looking at placing their home into escrow around November 2024.
• The luxury end, all homes above $2 million, account for 35% of the inventory and 17% of demand.
• Distressed homes, both short sales and foreclosures combined, comprised only 0.3% of all listings and 0.3% of demand. Only three foreclosures and two short sales are available today in Orange County, with five total distressed homes on the active market, down two from two weeks ago. Last year, eight distressed homes were on the market, similar to today.
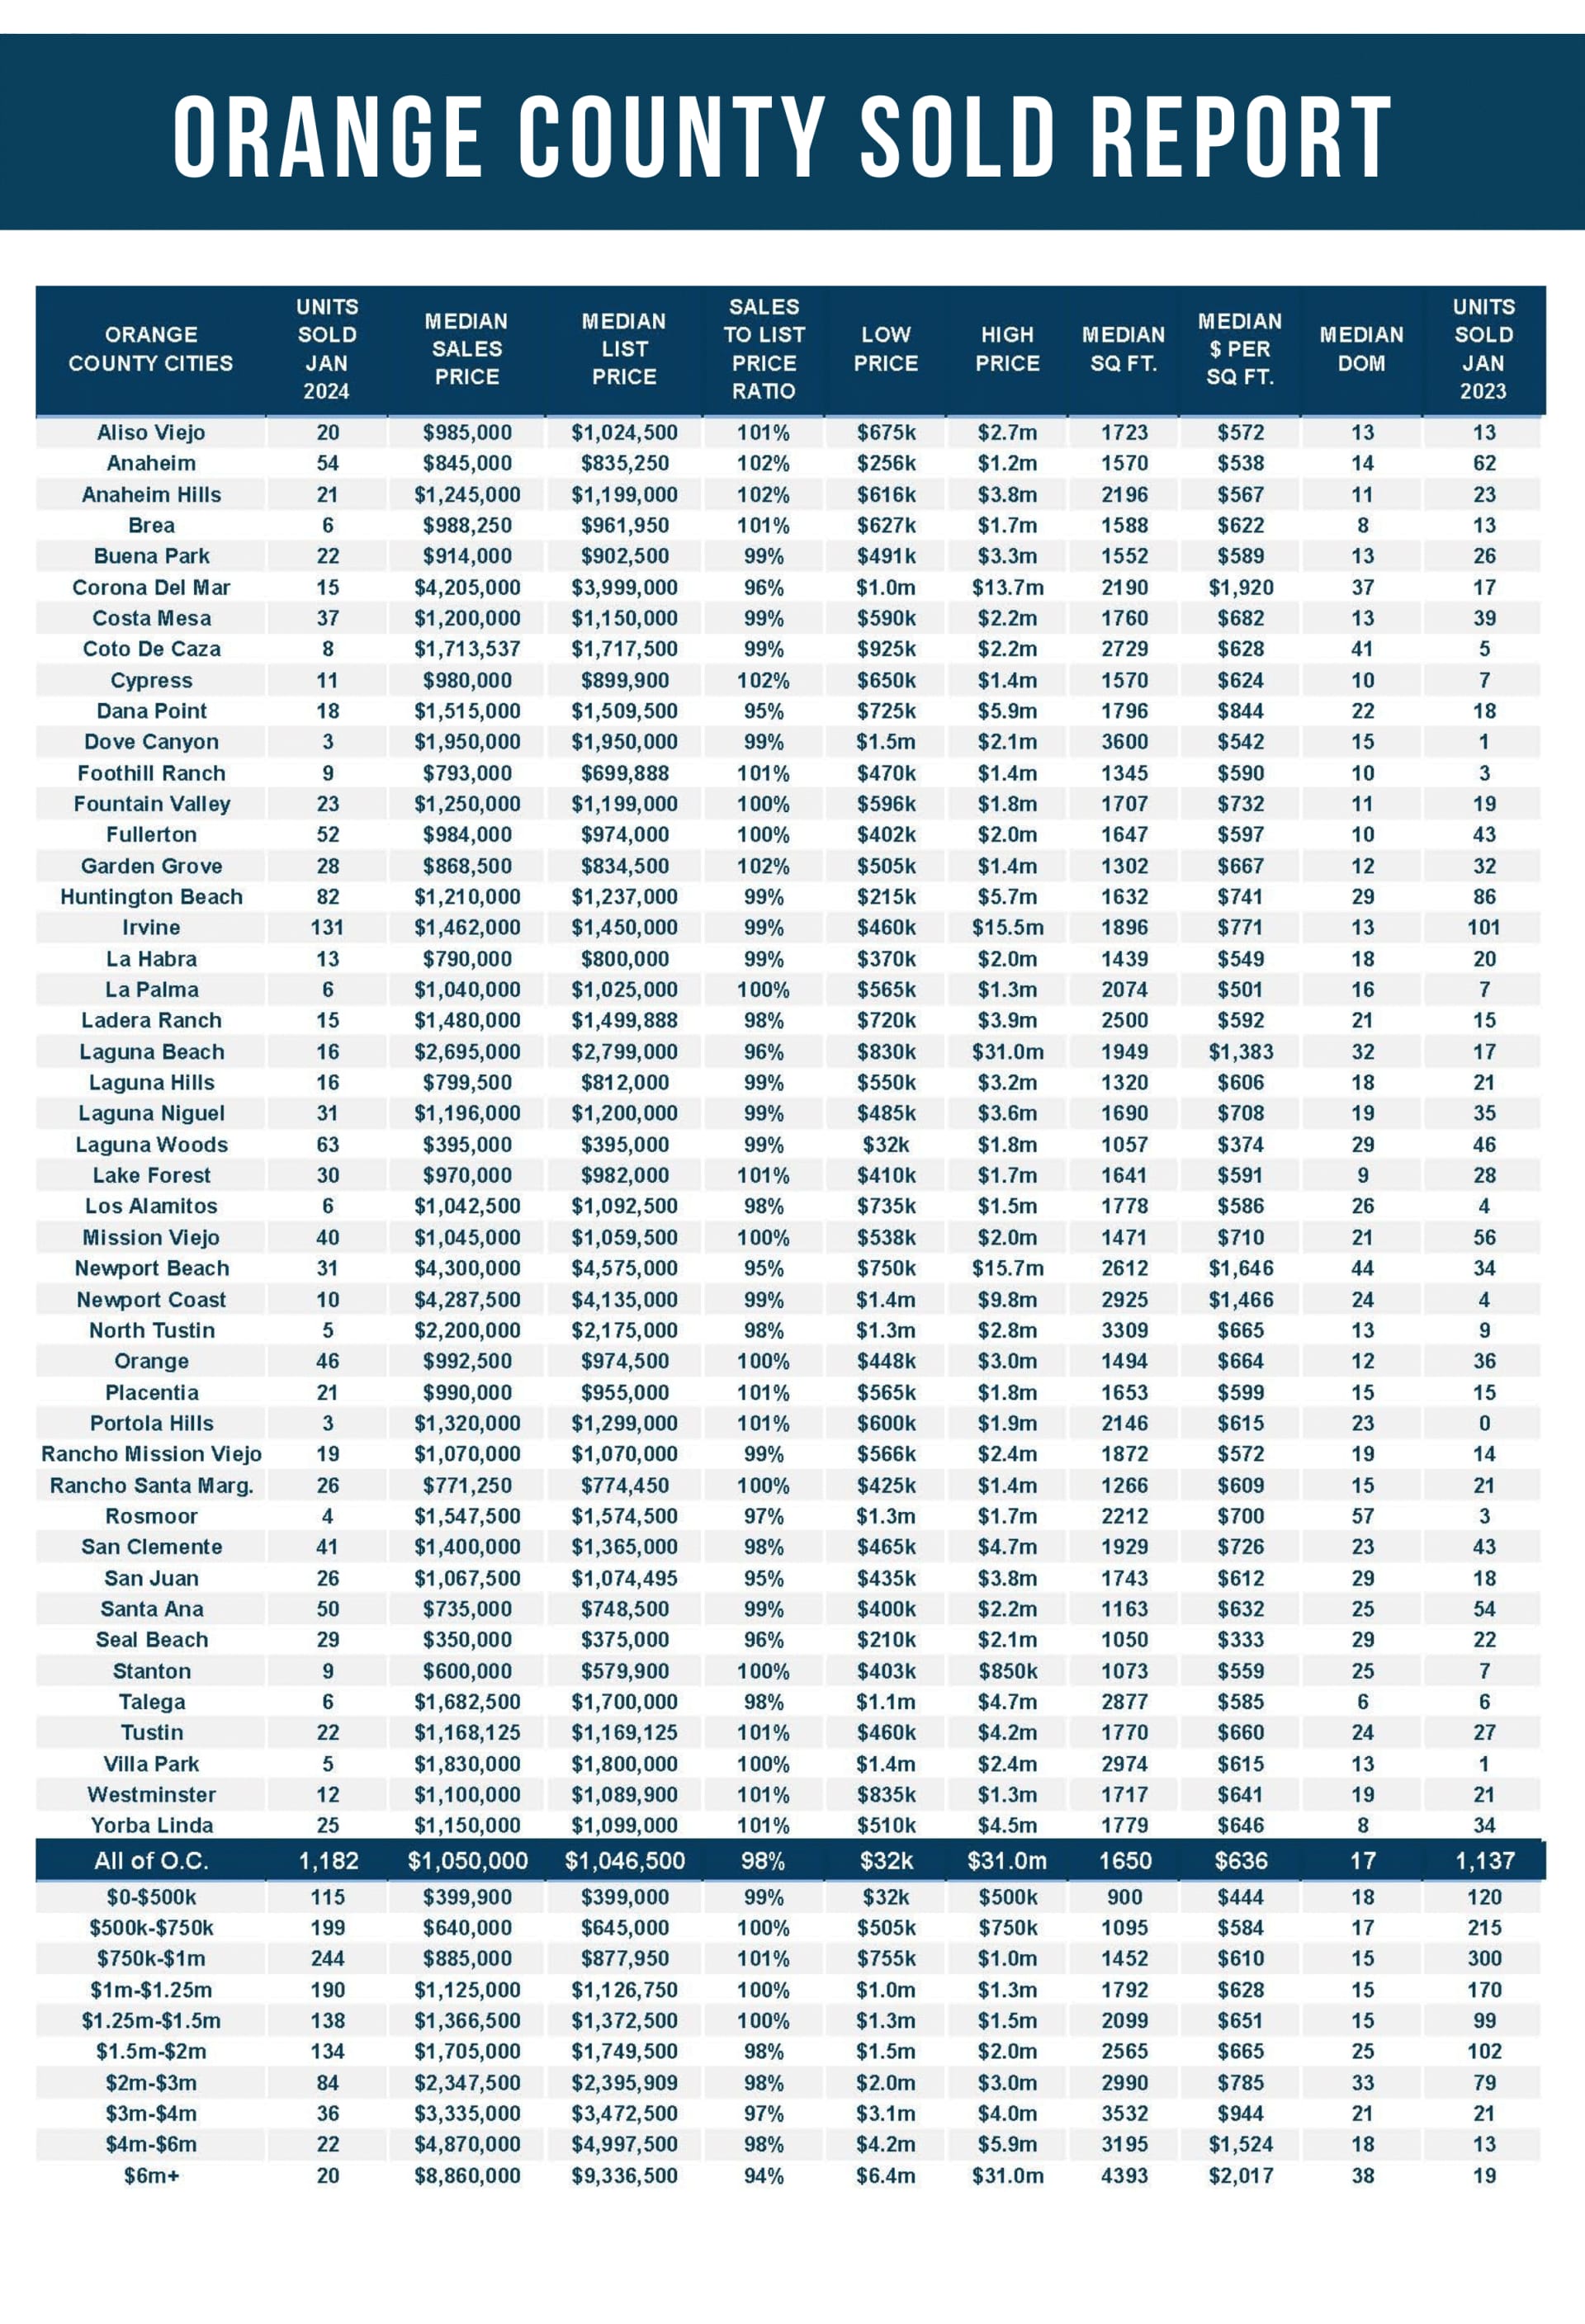
• There were 1,182 closed residential resales in January, up 4% compared to January 2023’s 1,137. December marked a 10% drop compared to December 2023. The sales-to-list price ratio was 98.5% for all of Orange County. Foreclosures accounted for 0.1% of all closed sales, and short sales accounted for 0.1%. That means that 99.8% of all sales were good ol’ fashioned sellers with equity.