January 24, 2024
Now that the holidays are over, it is time for housing to shift to the Winter Housing Market, when the inventory is flat, demand rises, and the pace of the market rapidly heats up.
Mixing a chronically low inventory with rising demand has always resulted in a much hotter housing market as winter progresses.
Laguna Beach is renowned for its beaches, coves, coastal parks, art galleries, trollies, and spectacular ocean views. Tourists flock there year-round, but it becomes exceptionally crowded during the summer after the kids get out of school. To beat the crowds, many arrive for vacation in May or early June only to be greeted with a thick layer of coastal fog that has trouble burning off during the day. At times, it can be pretty chilly. May and June are typically the cloudiest days of the year, often referred to as “May Gray” and “June Gloom.” Vacationers during these months have preconceived expectations of bathing on sun-soaked beaches and admiring picturesque sunsets, yet the gloomy cloud cover can last a week without sunshine.
Similarly, buyers who start their home search have preconceived expectations. Many expect plenty of choices, less buyer competition, and a slow pace that enables them to take their time isolating a home. Yet, in Southern California during the Winter Market, from mid-January to mid-March, buyers find that the pace of housing is a lot hotter than they initially anticipated, with fewer choices and plenty of buyer competition. In addition, as winter rolls along, the market grows stronger and stronger.
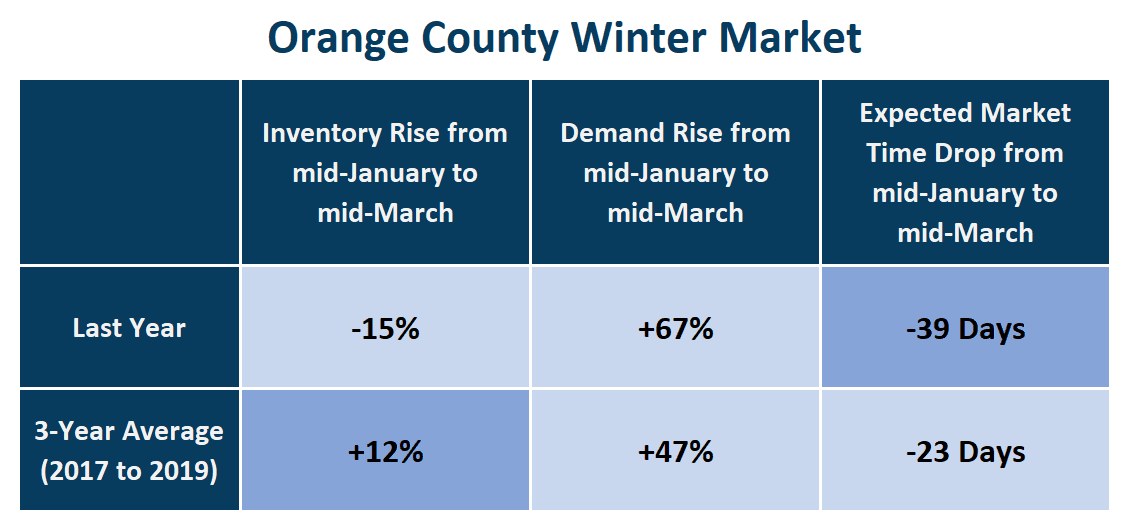
Regardless of the year or economic situation, the housing market always revs its engine starting in mid-January. It continues to accelerate weekly, like a hot rod in a drag race. The inventory of available homes to start the Winter market last year was at 2,536, the second lowest mid-January reading since tracking began in 2004, only behind 2022. By mid-March, the start of the Spring Market, the inventory had dropped to 2,168, a small drop of 368 homes or 15%. Demand, a snapshot of the number of new escrows over the prior month, soared higher from January to March, increasing from its lowest levels since tracking, 939 pending sales to 1,567 in March, up 67%, or an additional 628. The Expected Market Time, the time between coming on the market and opening escrow, decreased from 81 days to an insanely hot 42 days by spring, a difference of 39 days.
Demand was still at its lowest levels since tracking began throughout last year’s Winter Market, but it was paired up against an ultra-low supply of available homes. Despite the low demand readings and fewer closed sales, the market was extremely hot, and home values rose again after falling from July to December 2022. Due to the high mortgage rate environment, homes were not skyrocketing higher as they did from 2020 through the first half of 2022, but they were on the rise, and negotiations favored sellers. It was a seller’s market. Multiple offers had returned, especially in the entry-level price ranges.
In looking at the 3-year average before COVID, (2017 to 2019) when markets were more normal, the inventory grew during the Winter Market from 4,739 to 5,286 homes, up 12%, or 547 additional homes. Demand shot up from 1,710 to 2,517 pending sales, up a considerable 47%, or 808 additional pending sales. The 3-year average Expected Market Time dropped from 86 to 63 days, shedding 23 days. The inventory does not always rise during the season. Instead, it has fallen in five of the last 19 years, 26% of the time. Demand has consistently increased, and the Expected Market Time has plunged without exception.
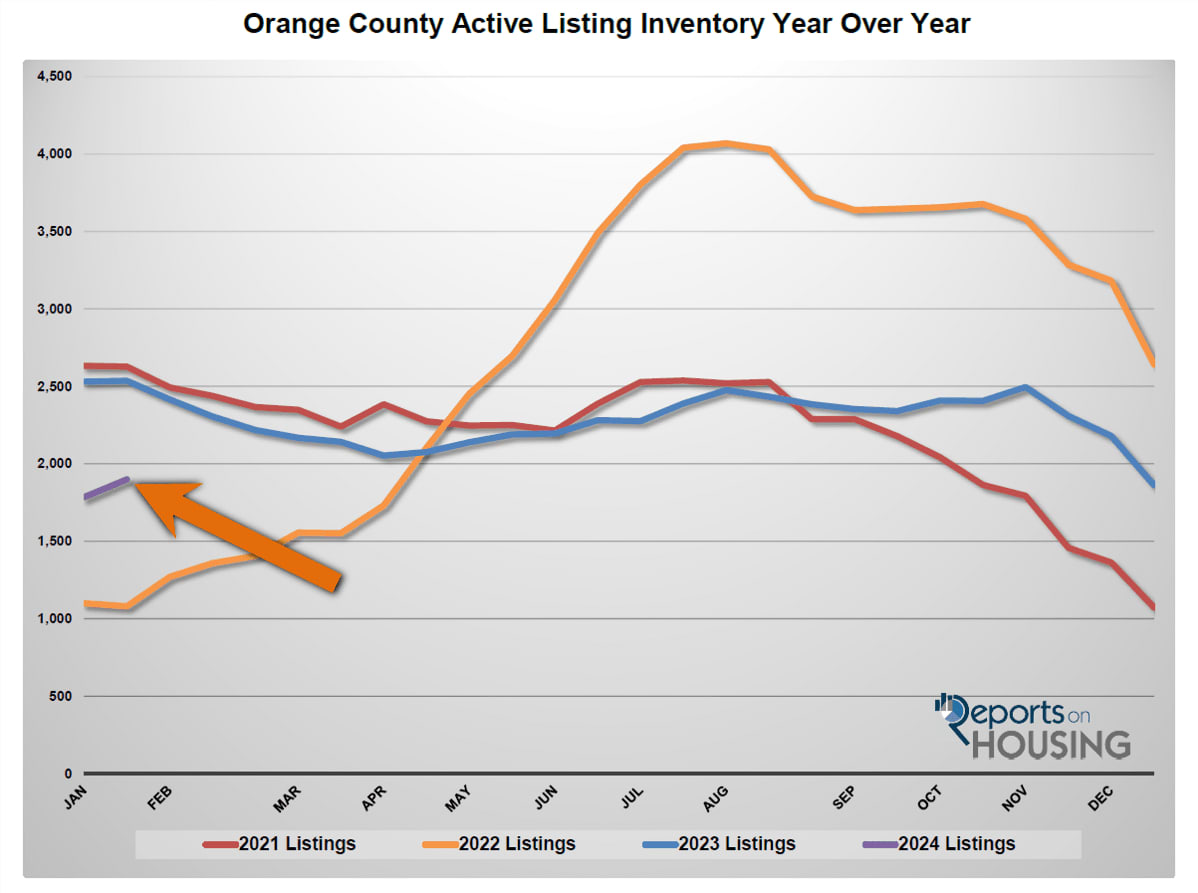
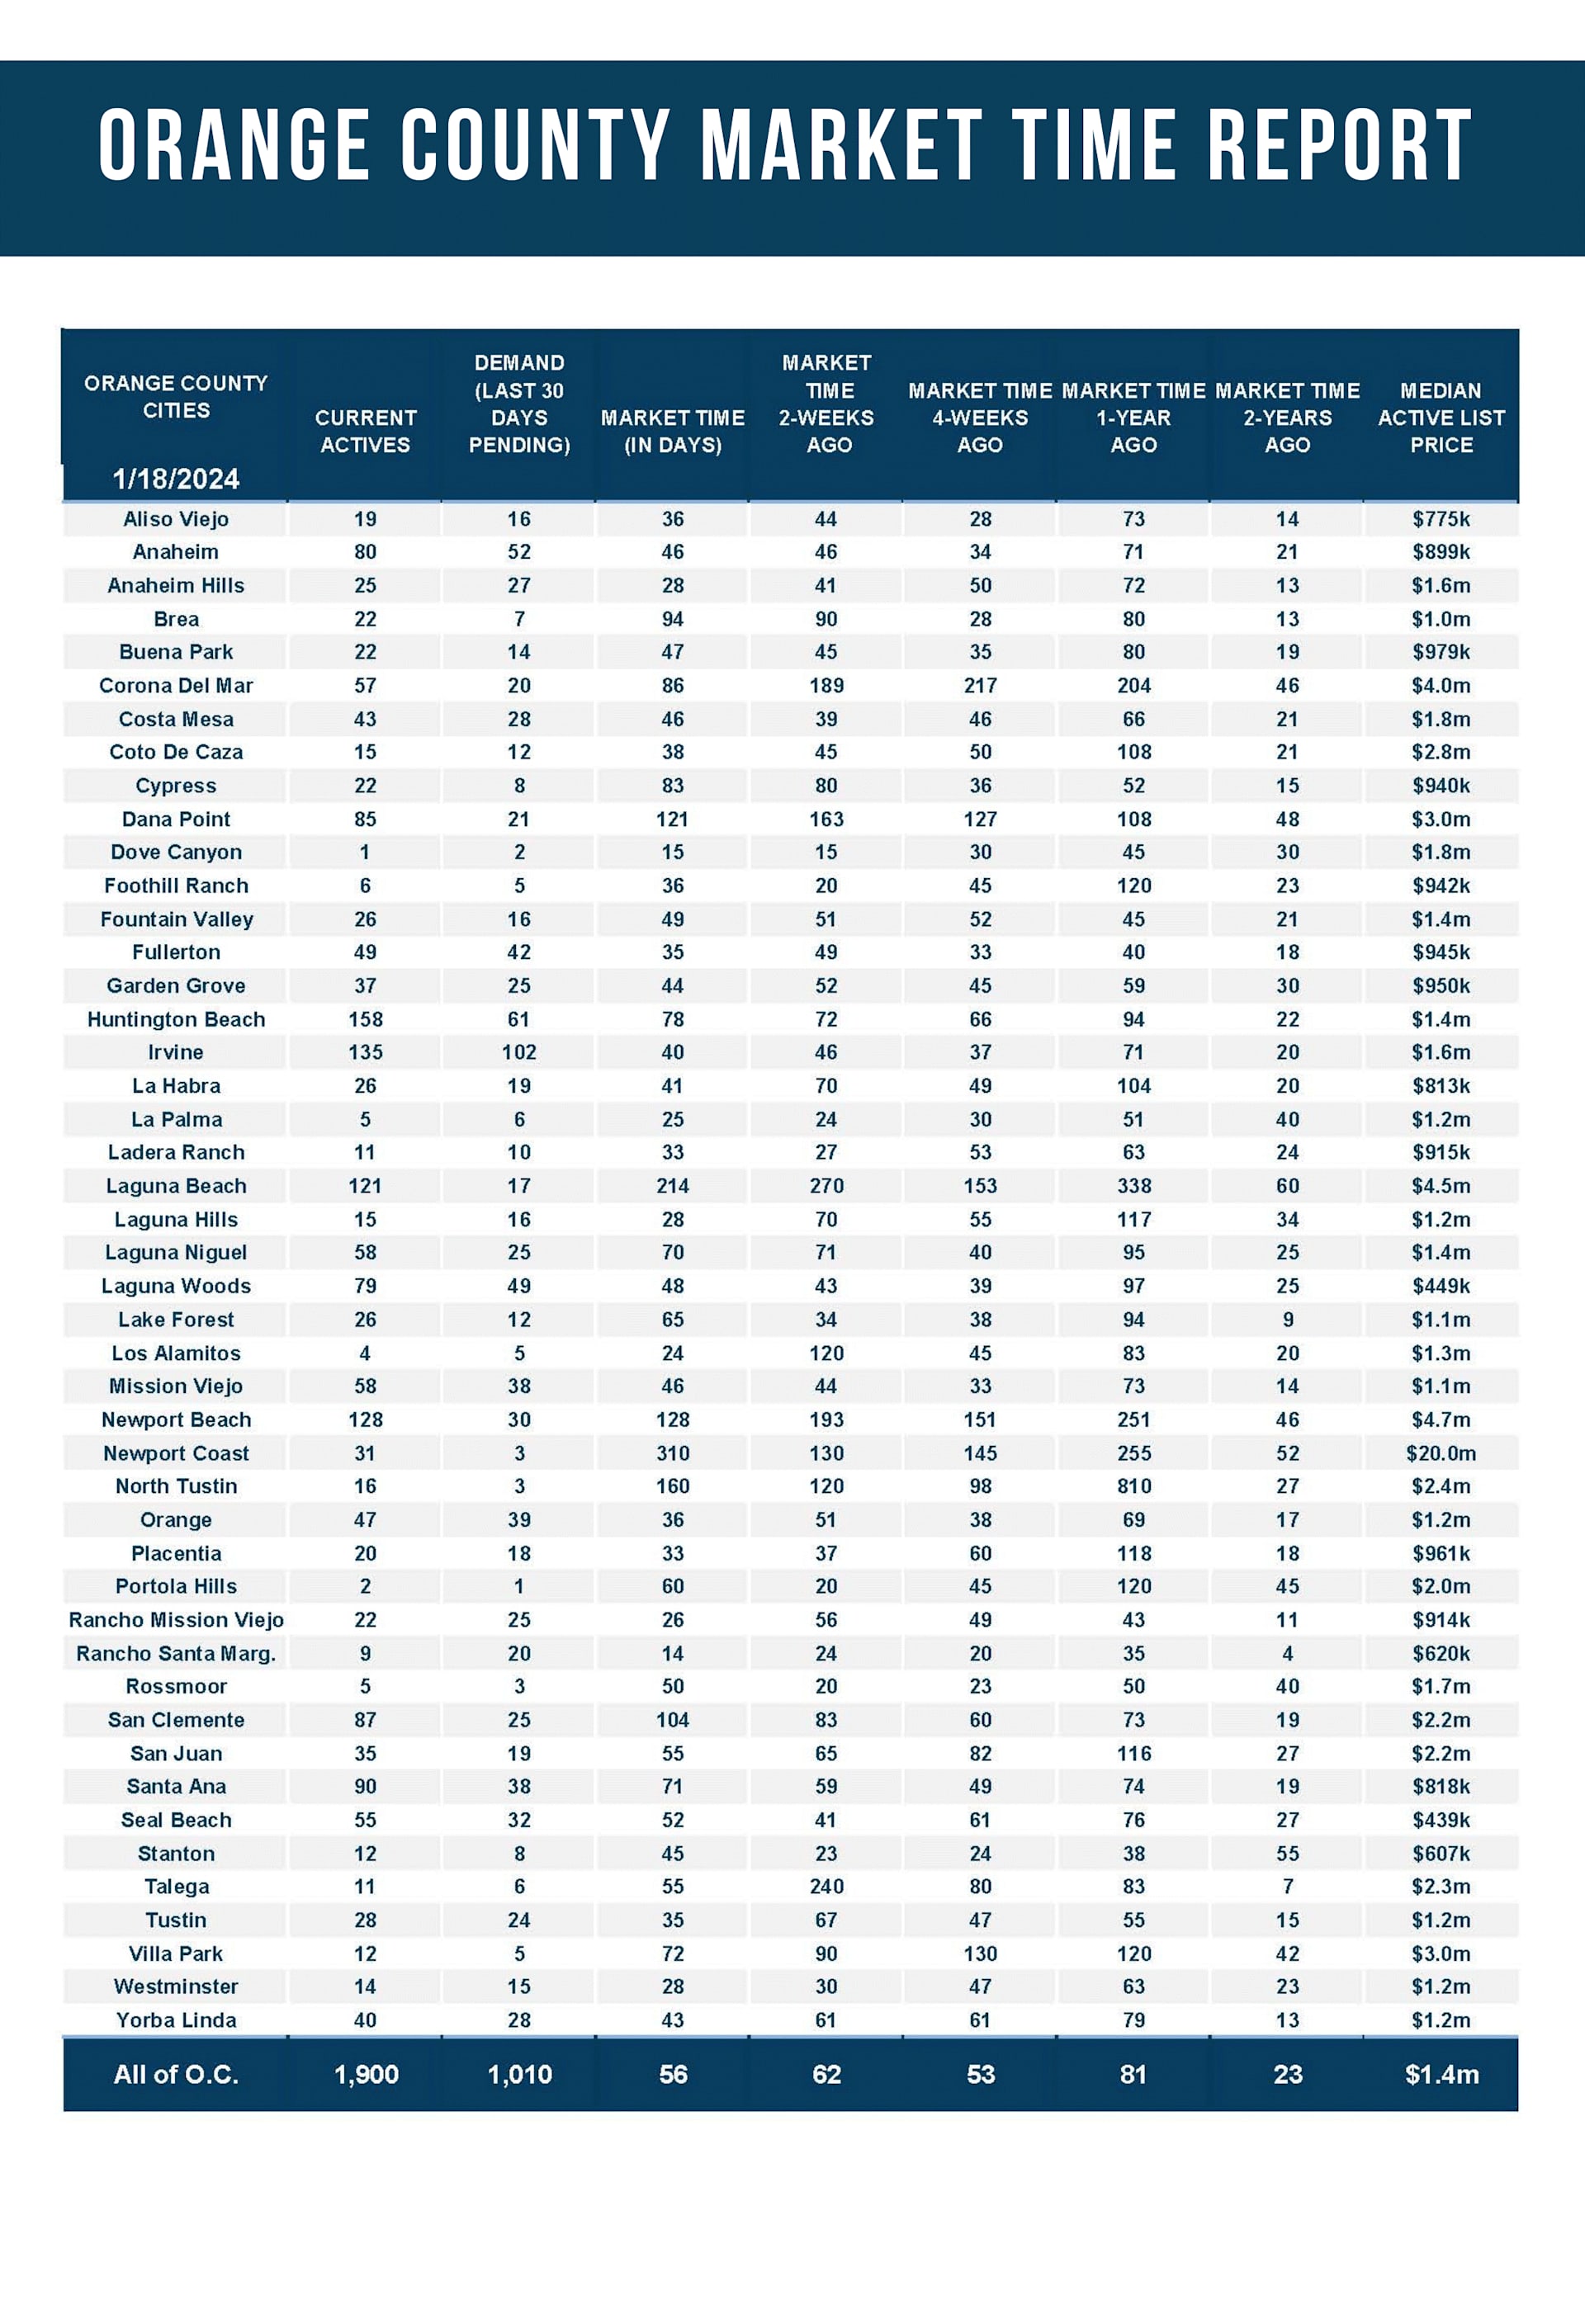
In November and December, the fewest homes are placed on the market. A lot more enter the fray starting in January, double December’s readings. Still, the numbers pick up even more substantially during the Spring Market, from mid-March through the end of May, and remain elevated through the summer. Even with lower demand levels due to the higher interest rate environment, this year's inventory will only slowly grow during the Winter Market. Yet, if rates drop from where they sit today at 6.87%, the supply could remain flat or even fall like last year. Contributing to the supply crunch is the fact that homeowners are “Hunkering Down,” unwilling to move due to their current underlying, locked-in, low fixed-rate mortgage. 85% of all Californians with a mortgage have a rate at or below 5%. There were 41% fewer new sellers in 2023 compared to the 3-year pre-pandemic average, or 16,151 missing FOR-SALE signs. Today’s inventory is at 1,900 homes, astonishingly lower than the pre-COVID average of 4,739 homes, 60% lower.
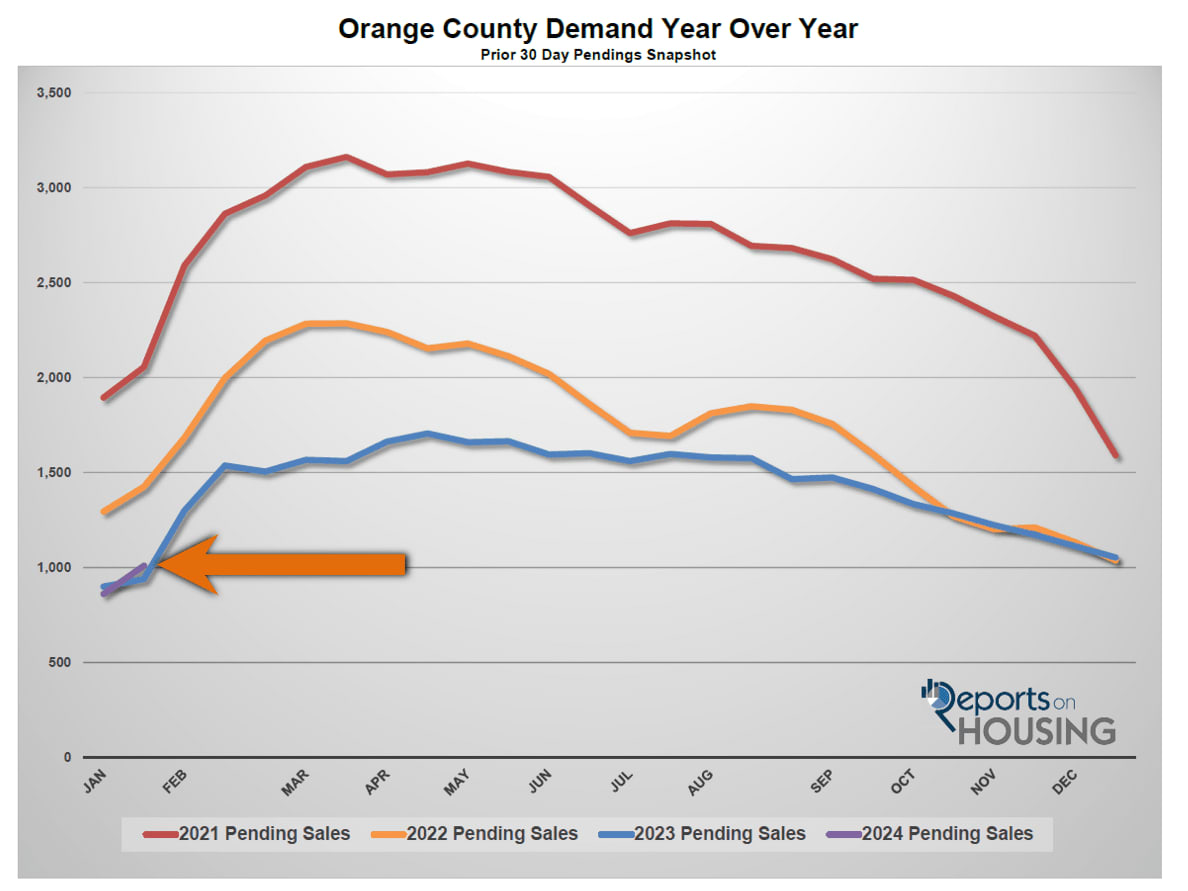
Demand will increase substantially from now through mid-March. Today’s 1,010 demand reading is the second lowest since tracking, only behind last year’s 939 pending sales. The pre-pandemic average was 1,710, a sizable 62% more. Nonetheless, there will be a lot more activity. An increasing number of buyers will start the process of searching for a home. The number of new prospective buyers will outpace the number of homes coming on the market, even at these muted levels.
With the inventory not changing much and demand surging higher, the Expected Market Time, the pace of the market, will fall, and it will be a red-hot winter this year for housing.
The active inventory increased by 6% in the past couple of weeks.
The active listing inventory increased by 115 homes in the past two weeks, up 6%, and now sits at 1,900, still the second lowest level for mid-January since tracking began 20 years ago, only behind 2022. It was the largest mid-January rise since 2000. Typically, the inventory rises from mid-January until peaking sometime during the summer, but the last several years have been far from normal. It is too early to tell if this year will be the first year since the onset of COVID, where the inventory behaves normally. There is no surge of homes coming on the market. Instead, the biggest issue that has been plaguing the market ever since rates exploded higher in 2022 is that homeowners have been unwilling to sell their homes and part with their low, fixed-rate mortgages. Only time will tell how the inventory proceeds from here. It could grow slowly, remain relatively flat, or even drop like last year.
Last year, the inventory was 2,536 homes, 33% higher, or 636 more. The 3-year average before COVID (2017 through 2019) was 4,739, an additional 2,839 homes, or 149% extra, more than double where it stands today.
Homeowners continue to “hunker down” in their homes, unwilling to move due to their current underlying, locked-in, low fixed-rate mortgage. For December, 962 new sellers entered the market in Orange County, 532 fewer than the 3-year average before COVID (2017 to 2019), 36% less. Last year, there were 1,028 new sellers, 7% more than today. It will be much easier to isolate when more sellers finally enter the fray in the future, which is anticipated as rates drop.
Demand skyrocketed higher by 17% in the past couple of weeks.
Demand, a snapshot of the number of new pending sales over the prior month, soared from 861 to 1,010 in the past couple of weeks, up 149 pending sales, or 17%, still its second lowest mid-January reading since tracking began in 2004, only behind last year. The holidays are officially in the rearview mirror. As a result, many people turn their attention towards purchasing a home during the Winter Market, now through mid-March. Expect demand to continue to soar higher until it peaks sometime during the spring.
Last year, demand was 939, 7% lower than today, or 71 fewer pending sales. The 3-year average before COVID (2017 to 2019) was 1,710 pending sales, 69% more than today, or an additional 700.
With demand soaring compared to the small rise in supply, the Expected Market Time (the number of days to sell all Orange County listings at the current buying pace) decreased from 62 to 56 days in the past couple of weeks. Last year, the Expected Market Time was 81 days, slower than today. The 3-year average before COVID was 86 days, also slower than today.
The luxury market improved in the past couple of weeks.
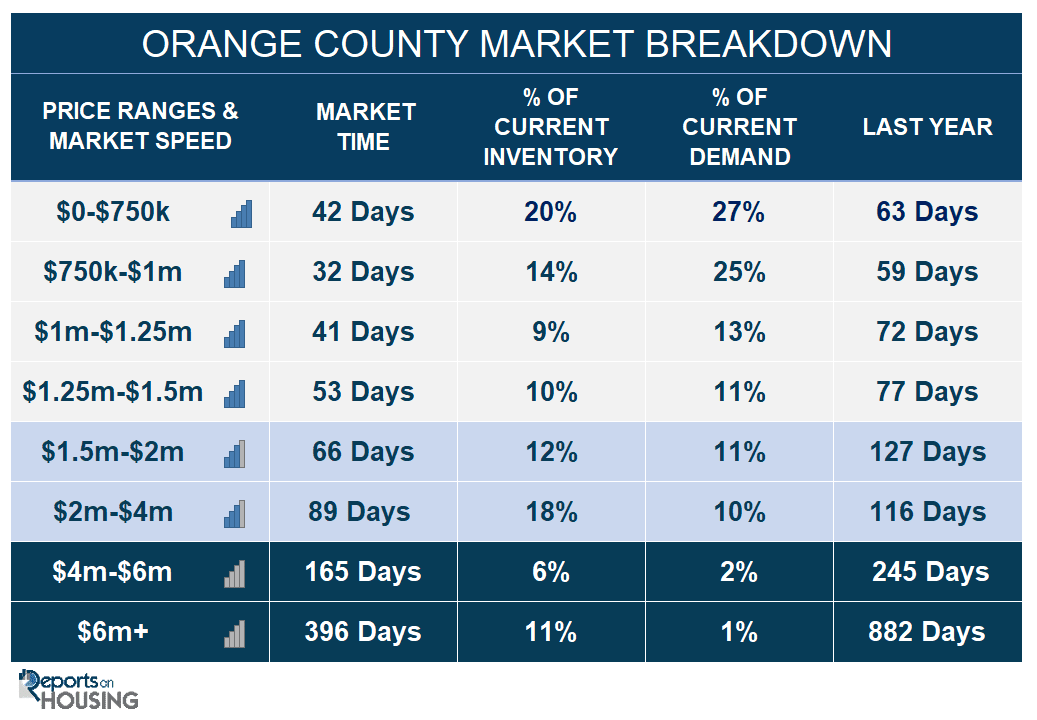
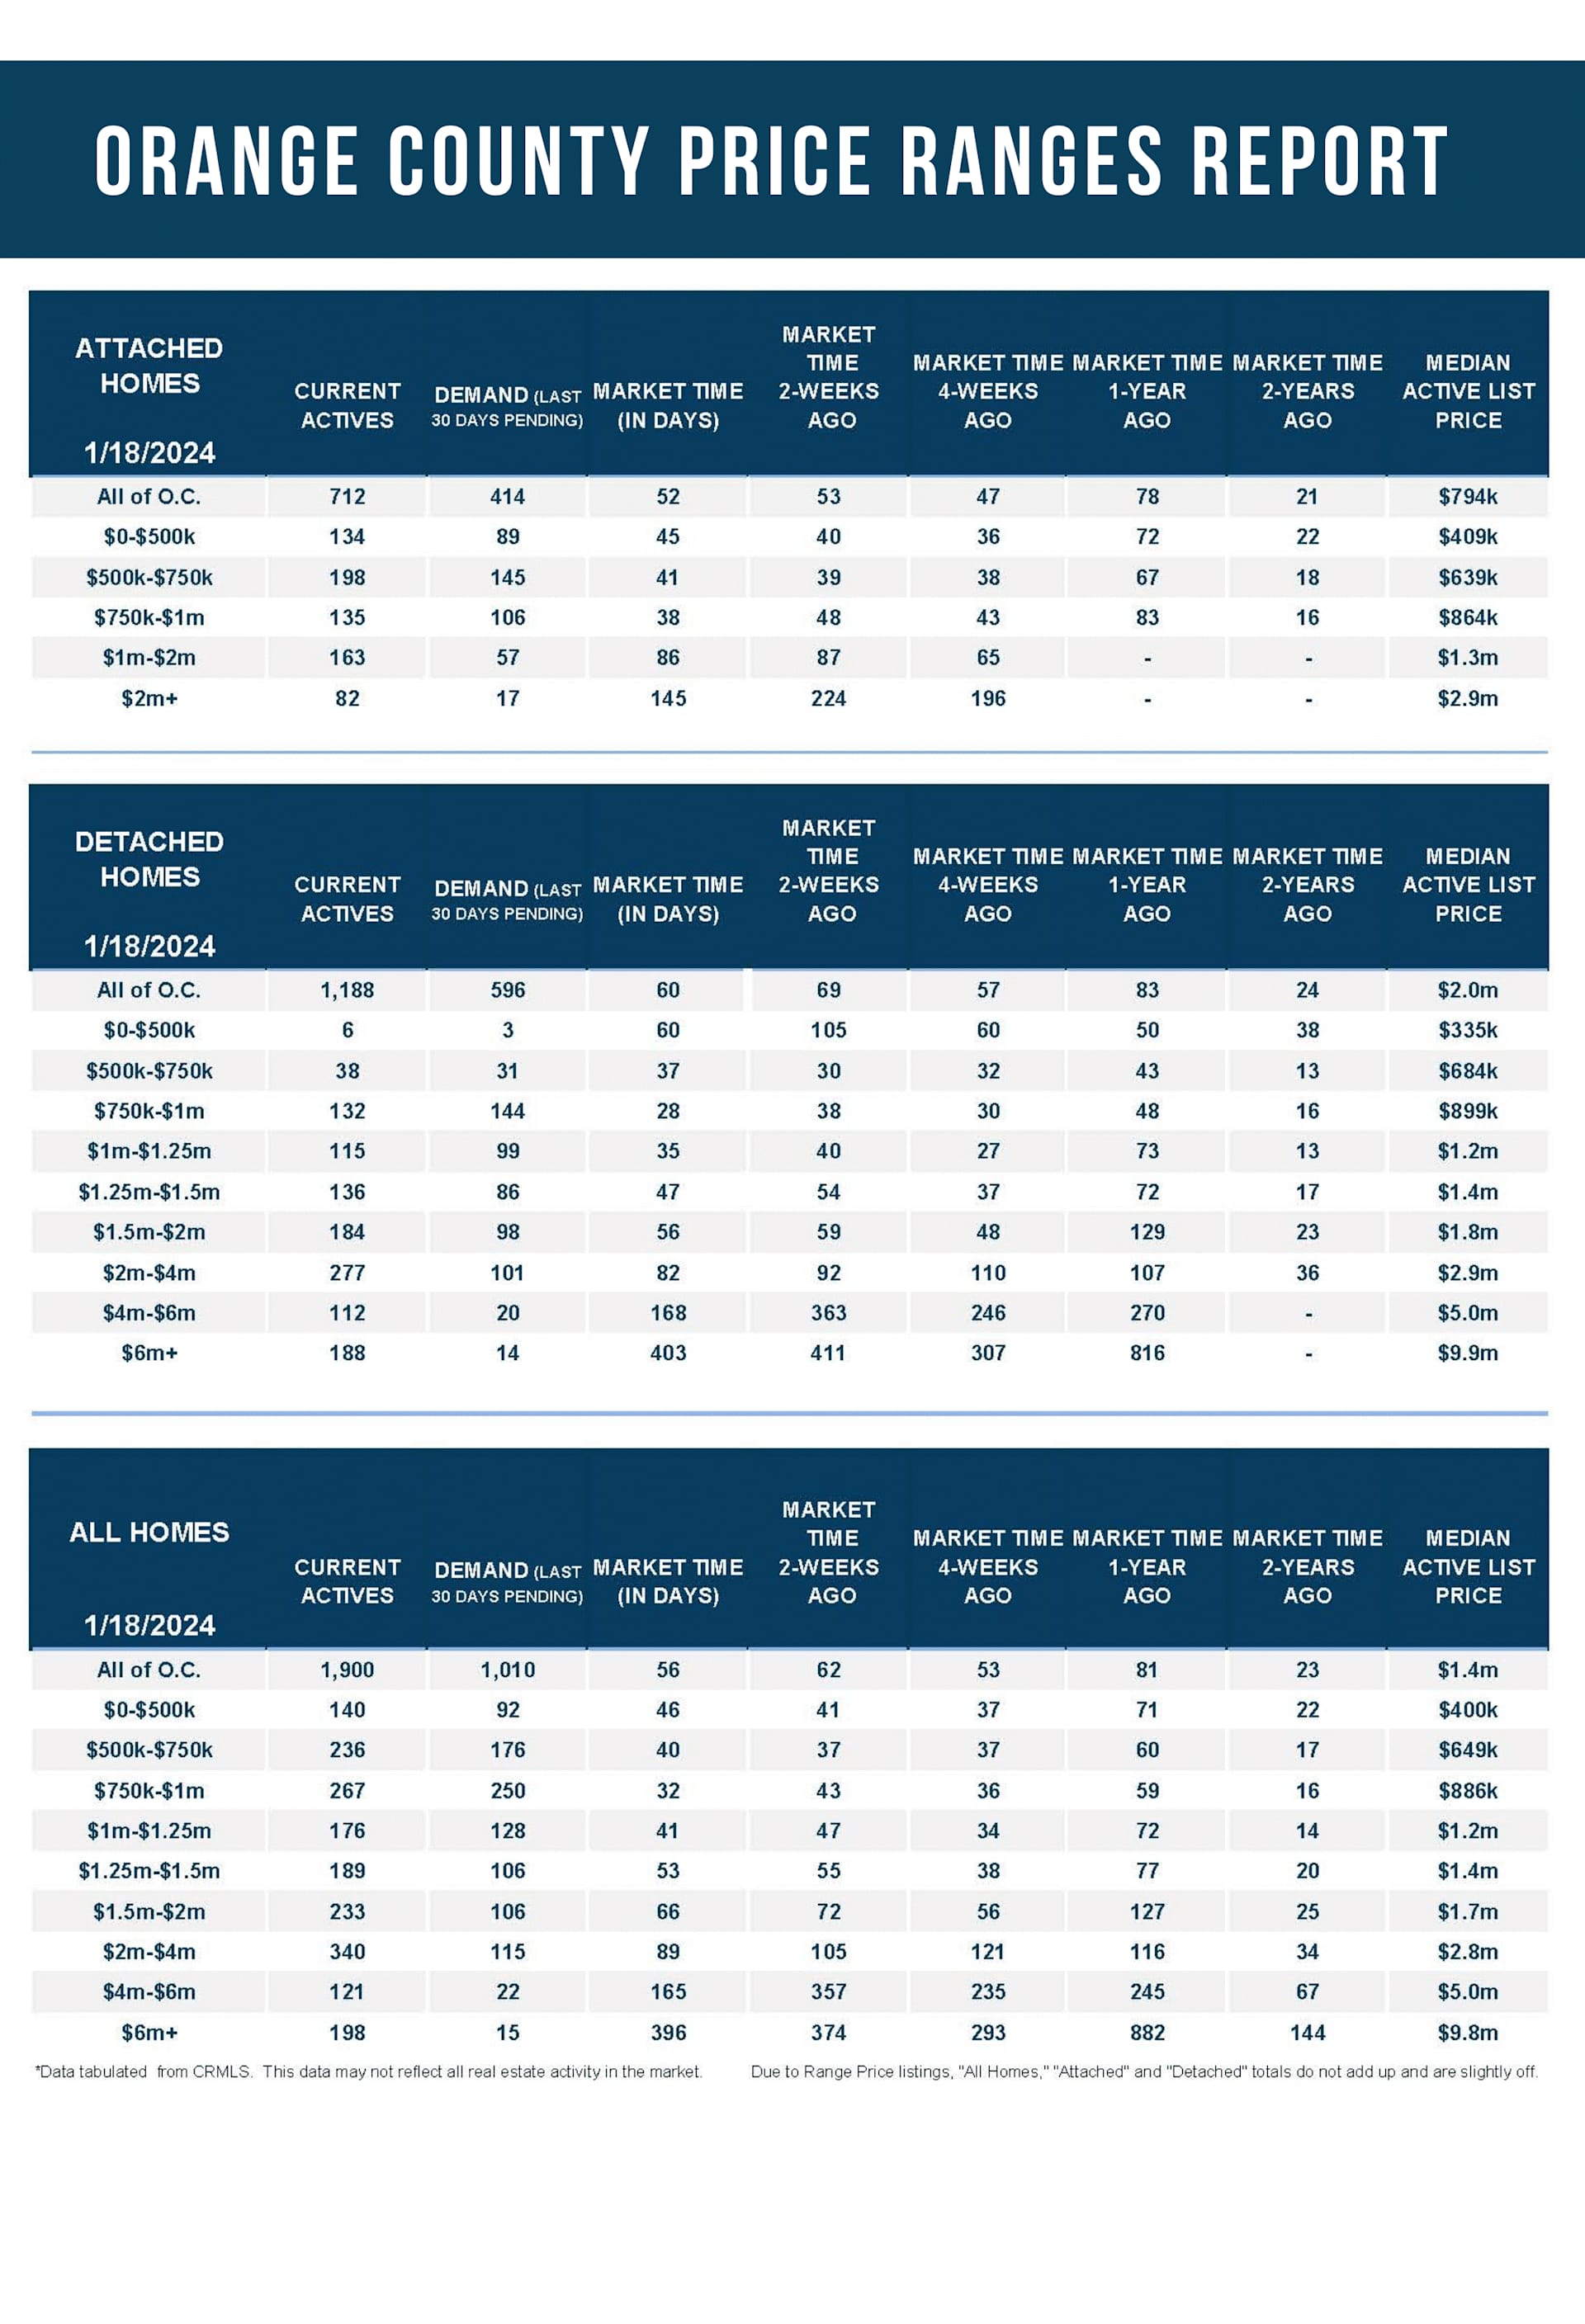
In the past couple of weeks, the luxury inventory of homes priced above $2 million increased from 620 to 659 homes, up 39, or 6%. Luxury demand grew by 37 pending sales, up 32%, and now sits at 152, its highest level since November. With demand climbing higher compared to the smaller rise in supply, the Expected Market Time for luxury homes priced above $2 million decreased from 162 to 130 days, its lowest reading since October. At 130 days, the luxury market is substantially slower than the 43-day Expected Market Time in the lower ranges (less than $2 million). The best approach to today’s luxury market remains careful pricing and plenty of patience.
Year over year, luxury demand is up by 49 pending sales or 48%, and the active luxury listing inventory is up by 78 homes or 13%. Last year’s Expected Market Time was 169 days, slower than today.
For homes priced between $2 million and $4 million, the Expected Market Time in the past two weeks decreased from 105 to 89 days. For homes priced between $4 million and $6 million, the Expected Market Time decreased from 357 to 165 days. For homes priced above $6 million, the Expected Market Time increased from 374 to 396 days. At 396 days, a seller would be looking at placing their home into escrow around February 2025.