It is getting harder and harder to find toy stores, bicycle shops, and sporting goods stores as more consumers turn to online shopping. Toys R Us closed its doors in 2017, Performance Bicycles sold its last bike in 2019, and Sports Authority filed for bankruptcy in 2016. These were all major national chains. Their closings, along with many small mom-and-pop shops, have made holiday shopping a lot more challenging. For many goods, what used to be a short drive down the street has turned into an internet search for a retailer that has what you are looking for “in stock,” and often a long drive. As a result, many have turned to internet shopping to avoid the hassle.
Similarly, finding homes available for sale has been getting harder and harder. While there used to be an abundant supply of homes to purchase, slowly but surely, the inventory has diminished substantially. There is no longer a plethora of homes to choose from. In many price ranges and neighborhoods, the shelves are bare, and the stock is limited. Buyers cannot turn to the Internet for an increased supply of houses. Instead, it has become a significant waiting game.
Today’s supply dilemma can be traced back to the Dodd-Frank Act, a 2010 law in response to the Great Financial Crisis. It prevented excessive risk-taking on Wall Street and provided common-sense protections for consumers in obtaining a loan. Predatory lending vanished. Nearly 35% of all mortgages were adjustable loans before the Great Recession. Today, it is less than 5%. Subprime lending, pick-a-payment plans, teaser adjustable-rate mortgages, and many other predatory lending products no longer exist. They have been replaced with fixed-rate mortgages and tight lending standards where borrowers must prove they can make their monthly mortgage payments.
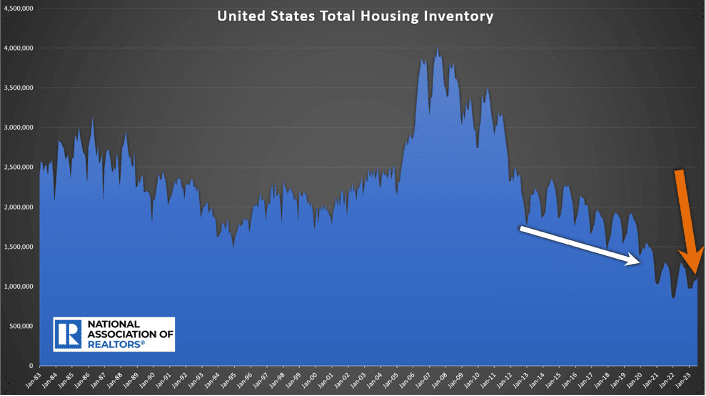
Tight lending standards and fixed rates have resulted in a very healthy homeowner stock where fewer homeowners get in a pickle that forces them to sell. The total U.S. housing inventory peaked at just over 4 million homes during the Great Recession. There was a glut of homes available. From 2012 through 2019, inventory levels shrunk from year to year.
According to the National Association of REALTORS®, in January 2012, there were 2,330,000 homes available across the U.S. It dropped to 1,880,000 in January 2014. In 2017, there were 1,680,000. Before the pandemic, there were 1,400,000 homes in January 2020, the lowest start to a year since tracking began in 1982. In 2021, it plummeted to 1,030,000; in 2022, it hit a record low of 850,000 homes. This year started with 980,000, yet it has had trouble rising due to a lack of homeowners willing to sell their homes. The July reading of only 1,110,000 is the lowest July level since tracking began.
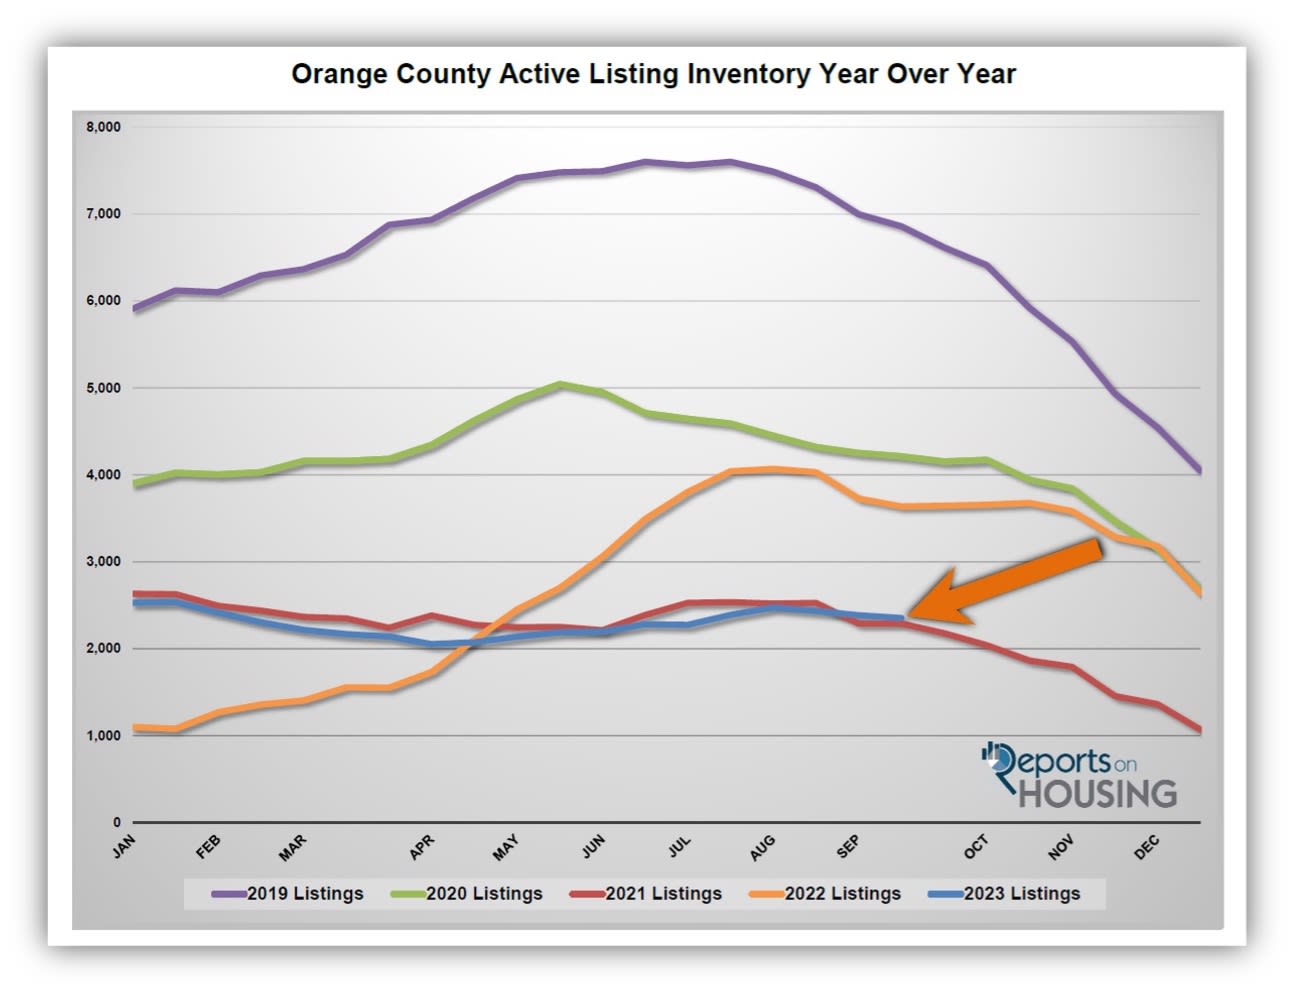
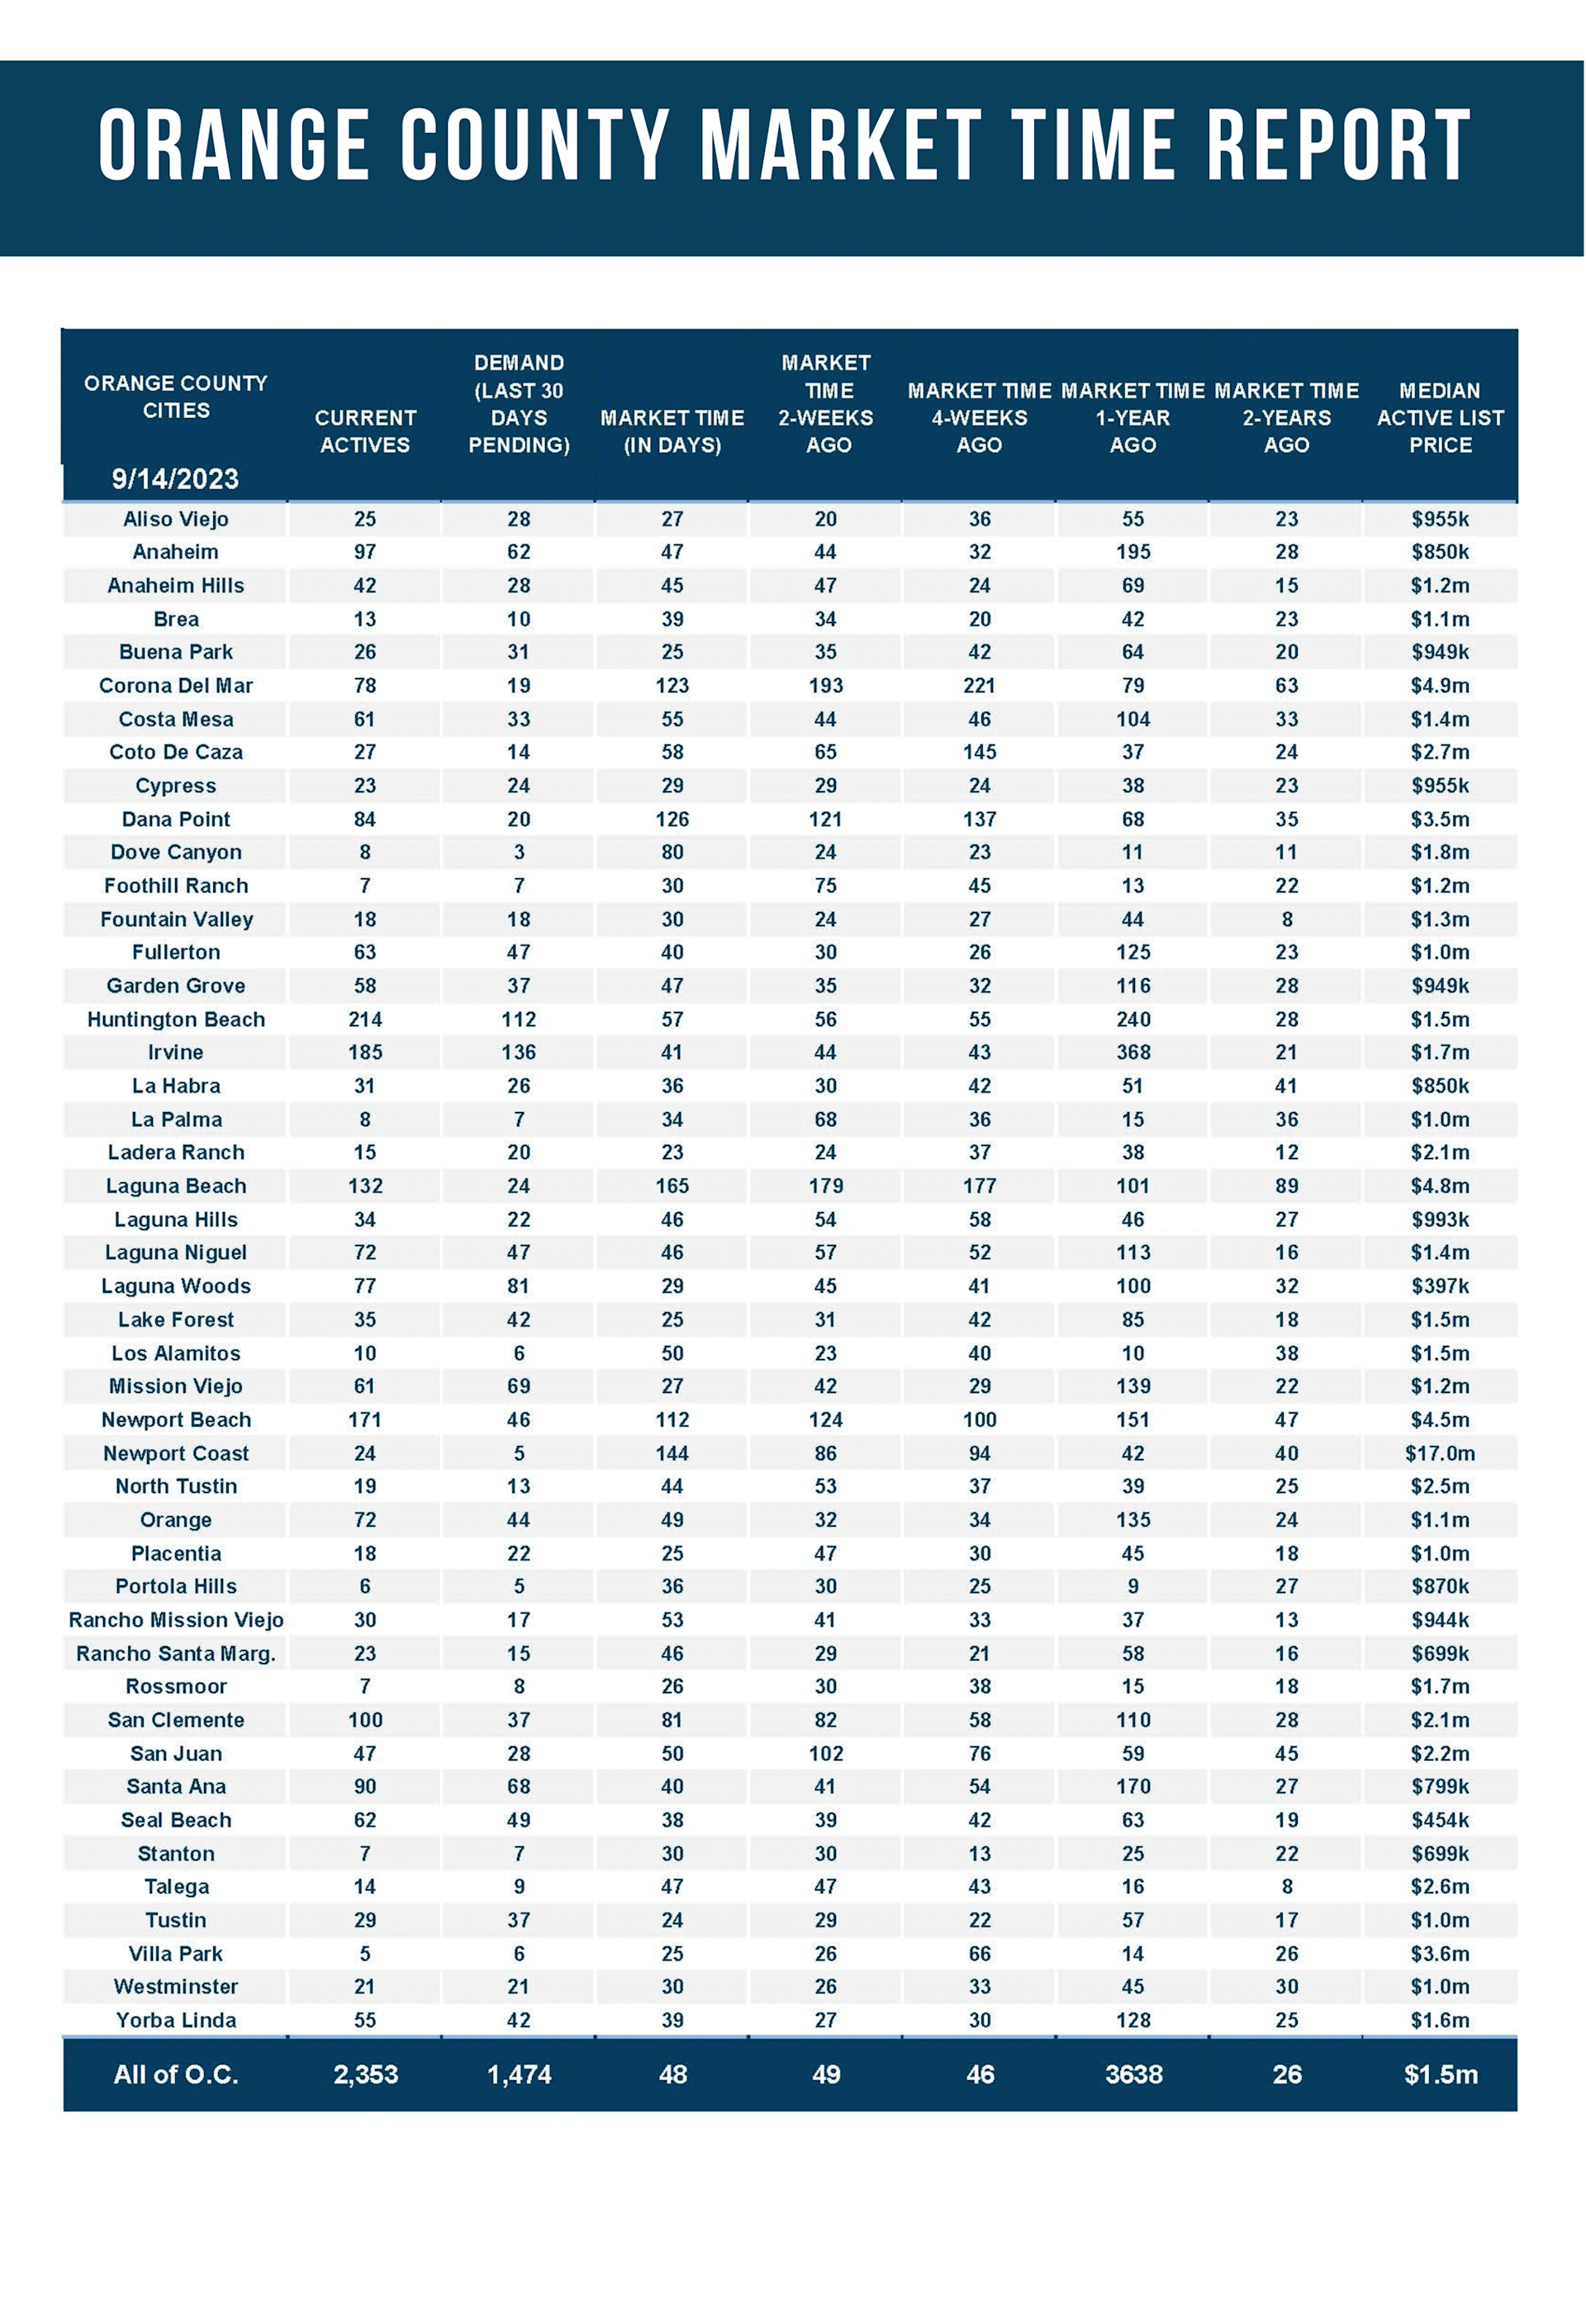
Orange County had over 8,000 homes at the start of 2012. It dropped to 4,700 in 2014 and 4,400 in 2017. In January 2020, before the start of COVID-19, it plunged to 3,700. In 2021, there were a little over 2,500, yet in 2022, it plummeted to slightly less than 1,000. While 2023 started with 2,431 homes, it stands at 2,353 today, only slightly more than the lowest reading on record for September at 2,289 in 2021. For perspective, in 2007, there were nearly 18,000 homes, more than seven times where Orange County sits today.
With a strong housing stock, there is a significant lack of forced selling. There will always be homeowners who must sell for various life reasons, including illness, death, divorce, and job loss; yet, with strong lending standards and high FICO scores, today’s homeowners are less apt to get in a financial jam. Before the Great Financial Crisis, many borrowers had adjustable-rate mortgages that adjusted monthly. Significant adjustments due to a change in the national economy often forced many to sell eventually. That circumstance today has virtually evaporated.
As a result of the homeowners’ strength, the number of distressed sales has diminished noticeably. In 2008, over six million homeowners lost their homes to foreclosure, compared to 22,700 in the first six months of 2023. In Orange County, 5,950 foreclosures and short sales were available in August 2008. There are only five available today.
Further aggravating the supply crisis is the fact that homeowners continue to “hunker down” in their homes, unwilling to move due to their current underlying, locked-in, low fixed-rate mortgage. The difference between their underlying rate and today’s prevailing rate is significant and precludes many homeowners from listing their homes for sale and moving to another house. 87% of Californians with a mortgage enjoy a fixed rate at or below 5%. Through August, there were only 16,741 sellers to hit the market, compared to the 3-year average before COVID (2017 to 2019) of 29,384, 76% more. These missing signs counter any potential rise in the inventory.
The strength of homeowners across the U.S. and in Orange County will continue to challenge the supply situation for years to come. The inventory crisis is not going anywhere anytime soon.
The active listing inventory decreased by 32 homes in the past two weeks, down 1%, and now sits at 2,353 homes, its lowest level since the start of July. It is the second lowest level since tracking began in 2004, behind 2021, with 64 additional homes. Orange County is one of the only Southern California markets to have already reached a peak,
h
occurred at the start of August at 2,475 homes, the lowest peak since tracking began. For the remainder of the year, expect the inventory to fall slowly, similar to the trajectory of 2021. This will lead to a very low inventory level to start 2024.
Last year, the inventory was 3,638 homes, 55% higher, or 1,285 more. The 3-year average before COVID (2017 through 2019) is 6,520, an additional 4,167 homes, or 177% extra, nearly triple where it stands today.
Homeowners continue to “hunker down” in their homes, unwilling to move due to their current underlying, locked-in, low fixed-rate mortgage. For August, 2,170 new sellers entered the market in Orange County, 1,367 fewer than the 3-year average before COVID (2017 to 2019), 39% less. These missing signs counter any potential rise in the inventory.
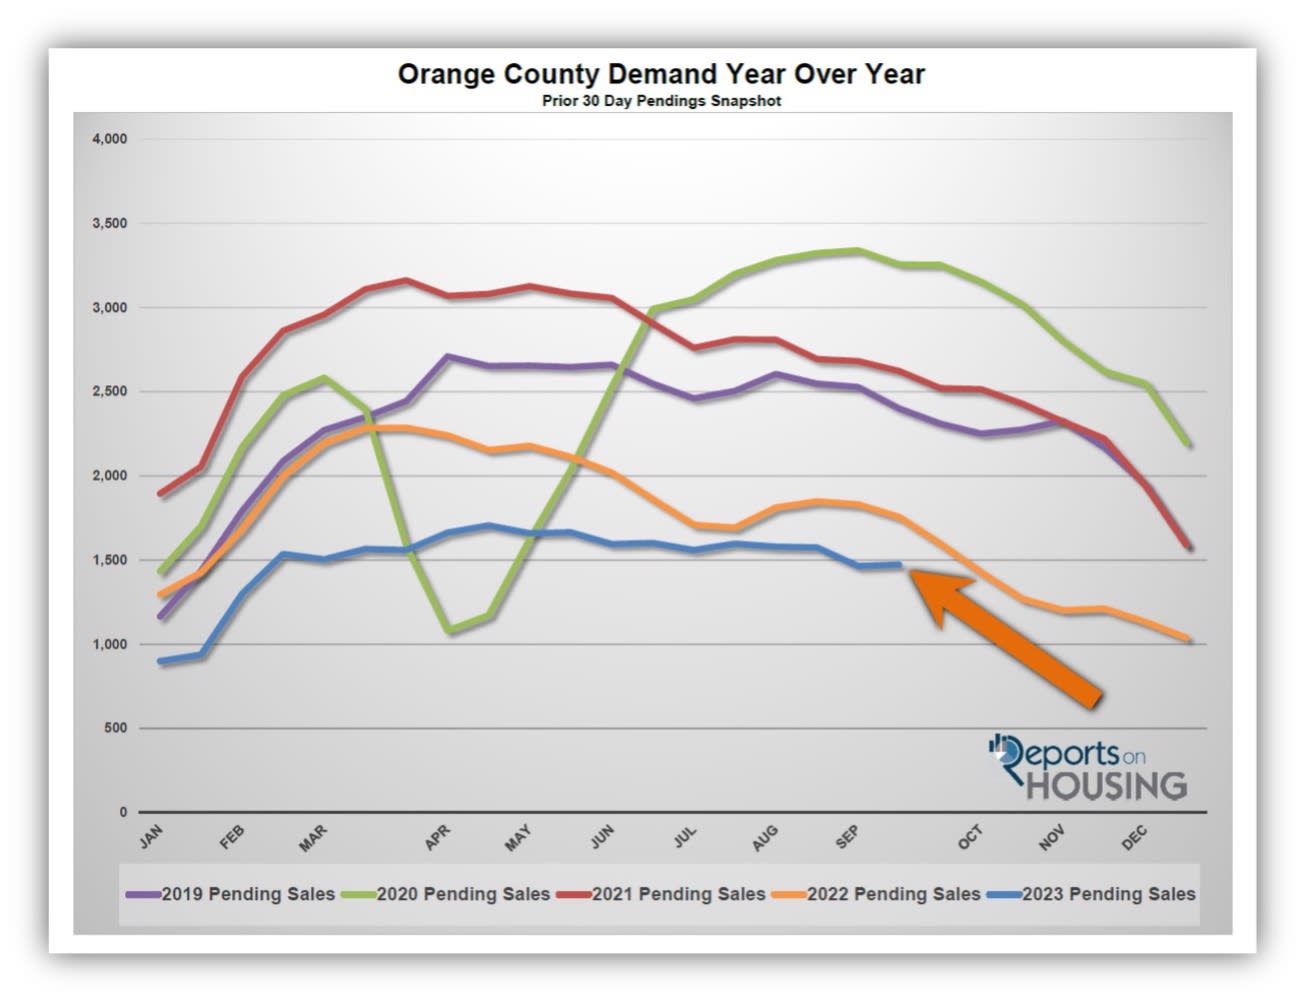
Demand increased by 1% in the past couple of weeks.
Demand, a snapshot of the number of new pending sales over the prior month, increased from 1,465 to 1,474 in the past couple of weeks, up nine pending sales, or 1%, its first rise since mid-July. Nonetheless, the Autumn Market has arrived. Expect demand to slowly fall for the rest of the year unless there is a significant change in mortgage rates. If the U.S. economy shows any signs of slowing, rates could drop below 7% for the first time since May, which would help stimulate demand with an improvement in home affordability.
Last year, demand was at 1,756, 19% more than today, or an extra 282. The 3-year average before COVID (2017 to 2019) was 2,363 pending sales, 60% more than today, or an additional 889.
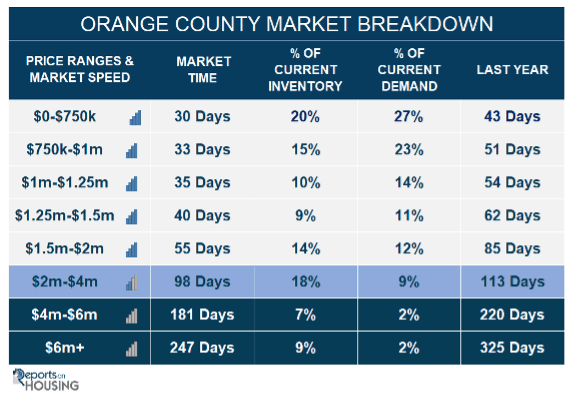
With a drop in supply and a slight rise in demand, the Expected Market Time (the number of days to sell all Orange County listings at the current buying pace) decreased from 49 to 48 days in the past couple of weeks. Last year, the Expected Market Time was 62 days, slower than today. The 3-year average before COVID was 84 days, significantly slower than today.
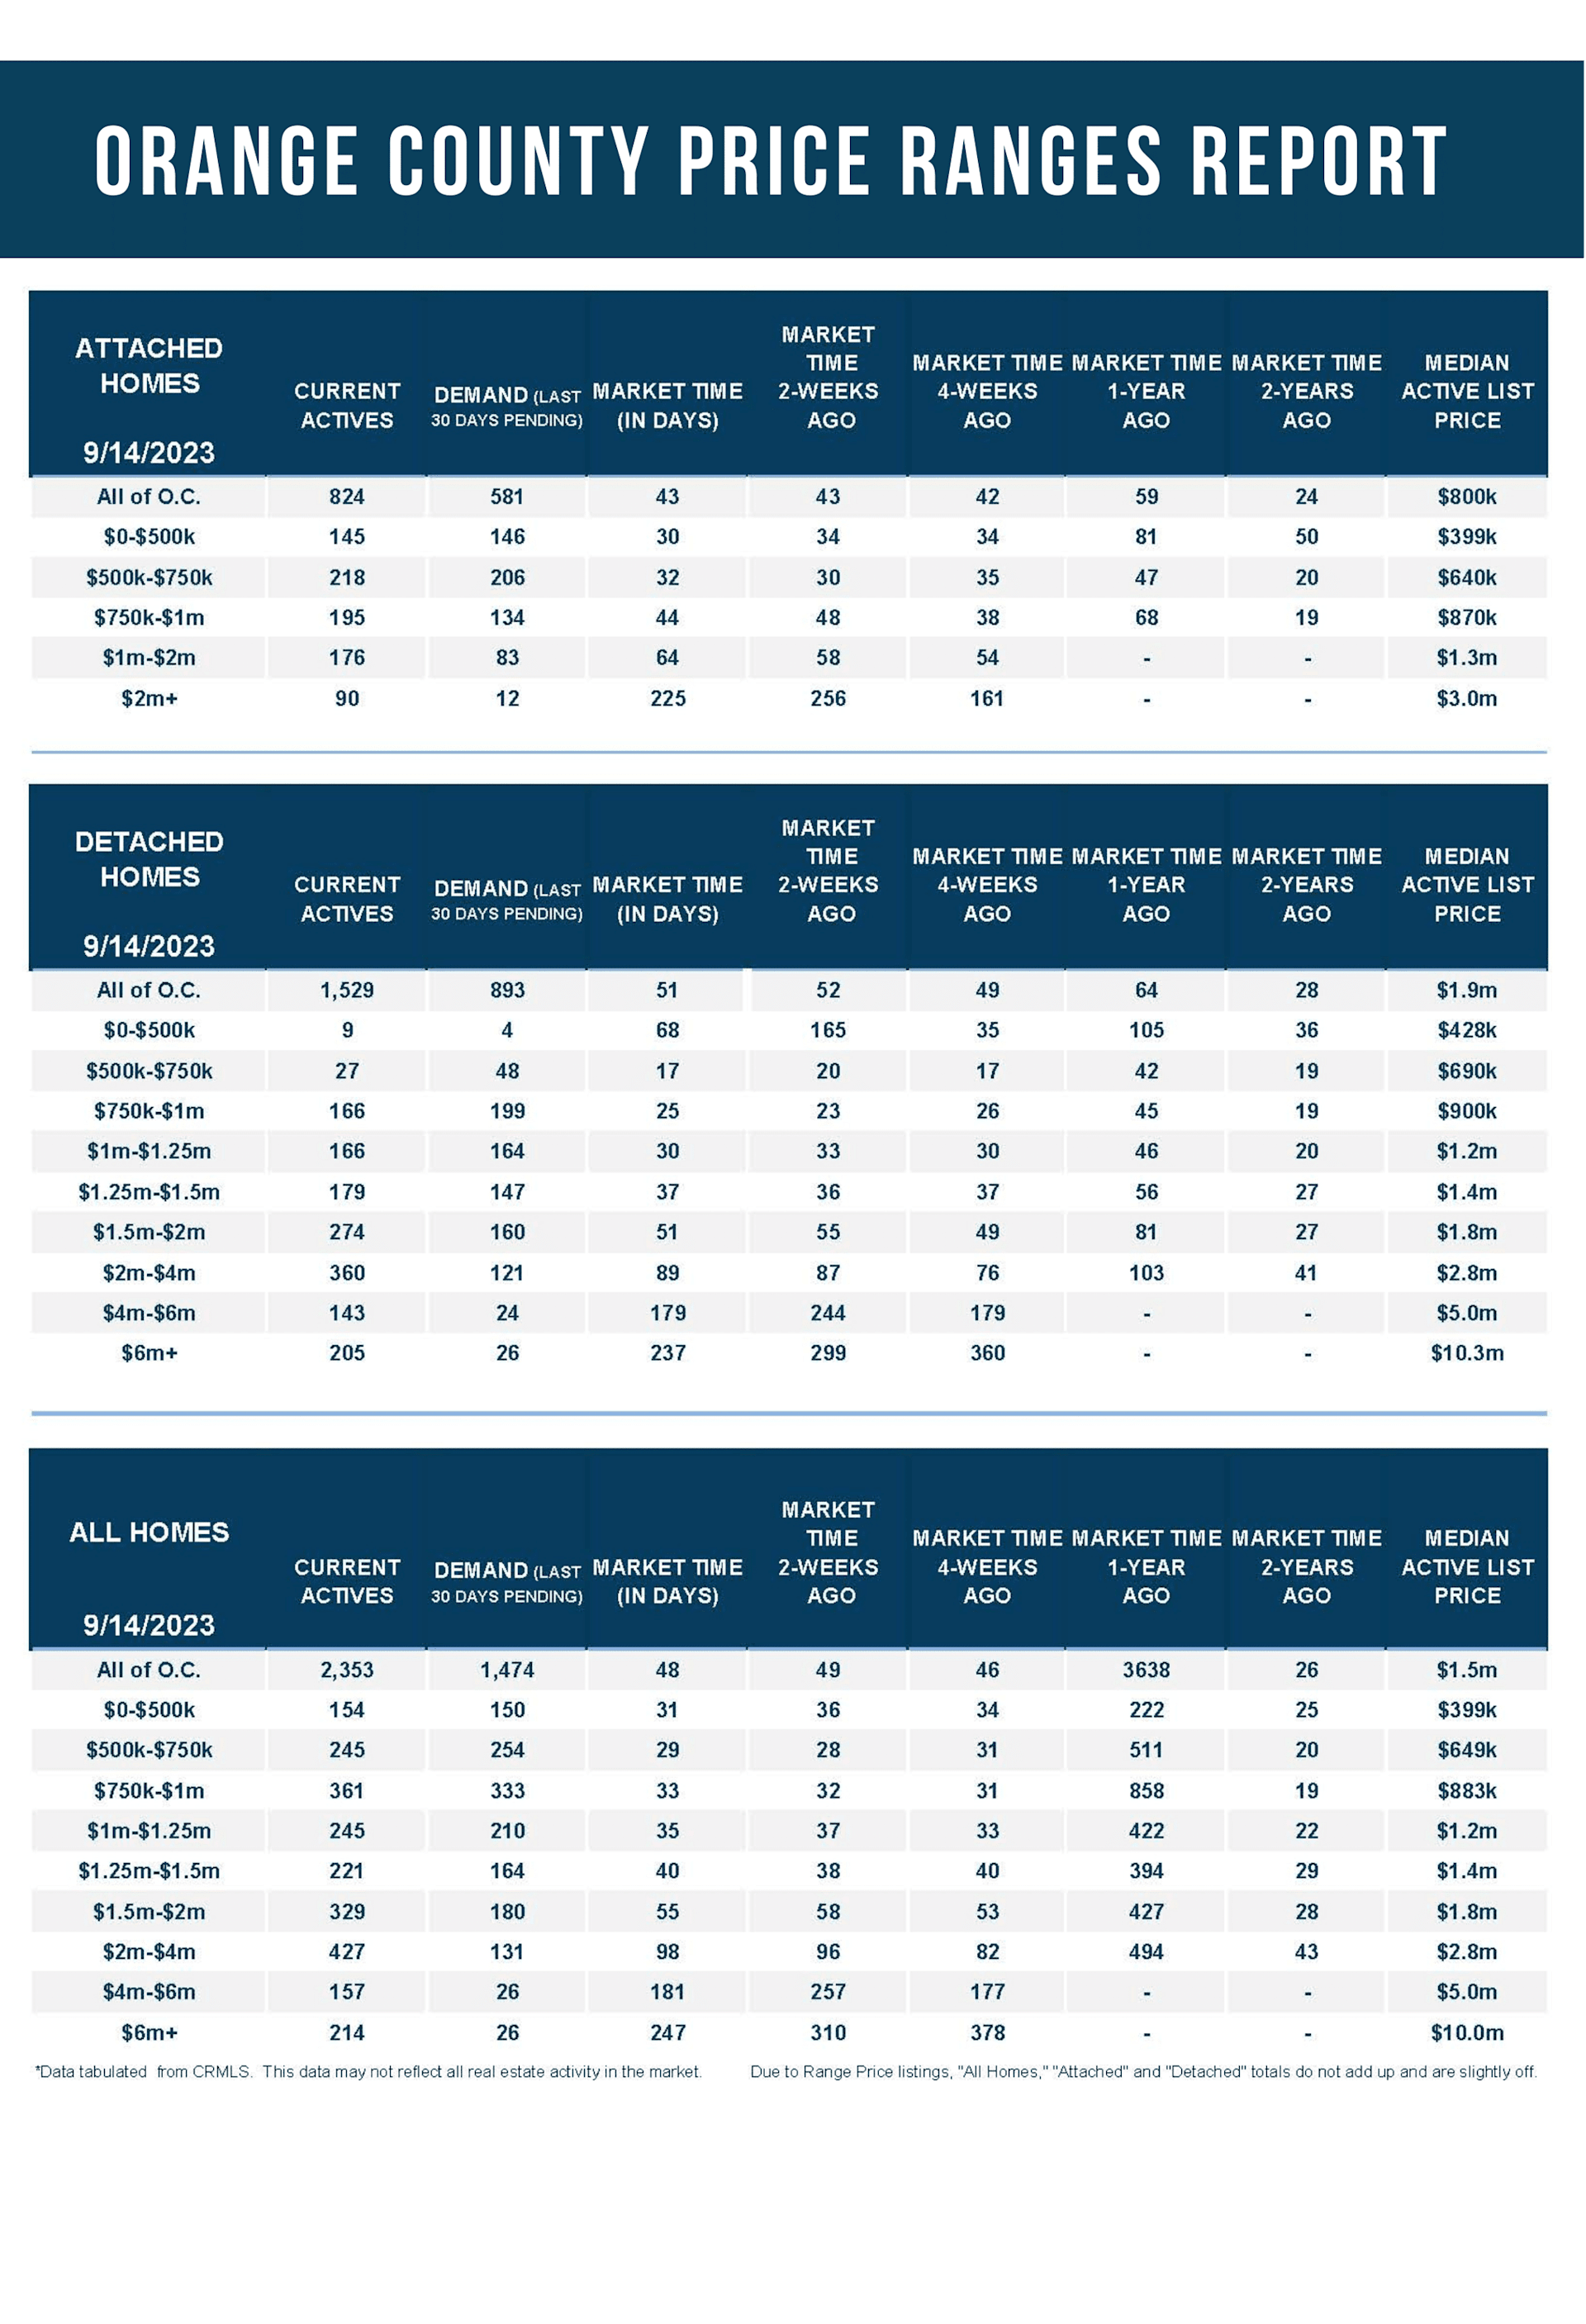
In the past couple of weeks, the luxury inventory of homes priced above $2 million increased from 792 to 798 homes, up six, or 1%. Luxury demand increased by 13 pending sales, up 8%, and now sits at 183. With demand climbing faster than supply, the Expected Market Time for luxury homes priced above $2 million decreased from 140 to 131 days. Yet, at 131 days, luxury sellers must still have a calculated approach to the housing market, ignoring all the noise that the market is hot in the lower ranges.
Year over year, luxury demand is up by 15 pending sales or 9%, and the active luxury listing inventory is down by six homes or 1%. Last year’s Expected Market Time was 144 days, slightly slower than today.
For homes priced between $2 million and $4 million, the Expected Market Time in the past two weeks increased from 96 to 98 days. For homes priced between $4 million and $6 million, the Expected Market Time decreased from 257 to 181 days. For homes priced above $6 million, the Expected Market Time decreased from 310 to 247 days. At 247 days, a seller would be looking at placing their home into escrow around May 2024.
Have a great week.