For sellers who initially do not price their homes carefully and must reduce down the road, they likely will net less upon closing.
To walk away from closing with the most money, it is crucial to carefully price a home at the outset of coming on the market.
Will Rogers once said, “You never get a second chance to make a first impression.” That quote not only applies to meeting someone for the first time, it also applies to real estate. When a home is placed on the market, ready to be greeted by buyers, the first impression is everything. Many homeowners spend weeks, or even months, preparing their homes before pounding in the FOR-SALE sign in the yard. Many install new carpet and paint throughout. Deferred maintenance is addressed. The yard is spruced up with freshly planted flowers and a layer of topsoil. The goal is to get top dollar for a home.
Yet, the most critical first impression is the price of a home. Many homeowners want to “test the market” and see if they can procure a higher price than what is suggested by comparable pending and recent closed sales. They push the envelope to ensure they are not leaving money on the table. After all, they can always reduce the asking price down the road, right? Unfortunately, in looking at the data, overpricing is not the best strategy to net the most amount of money possible.
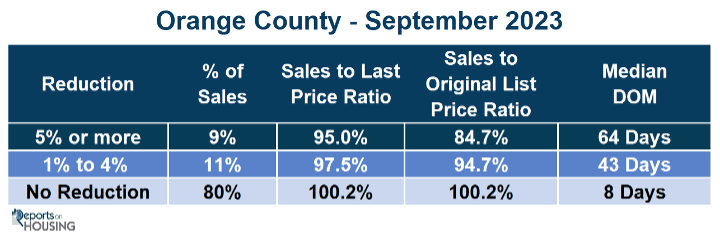
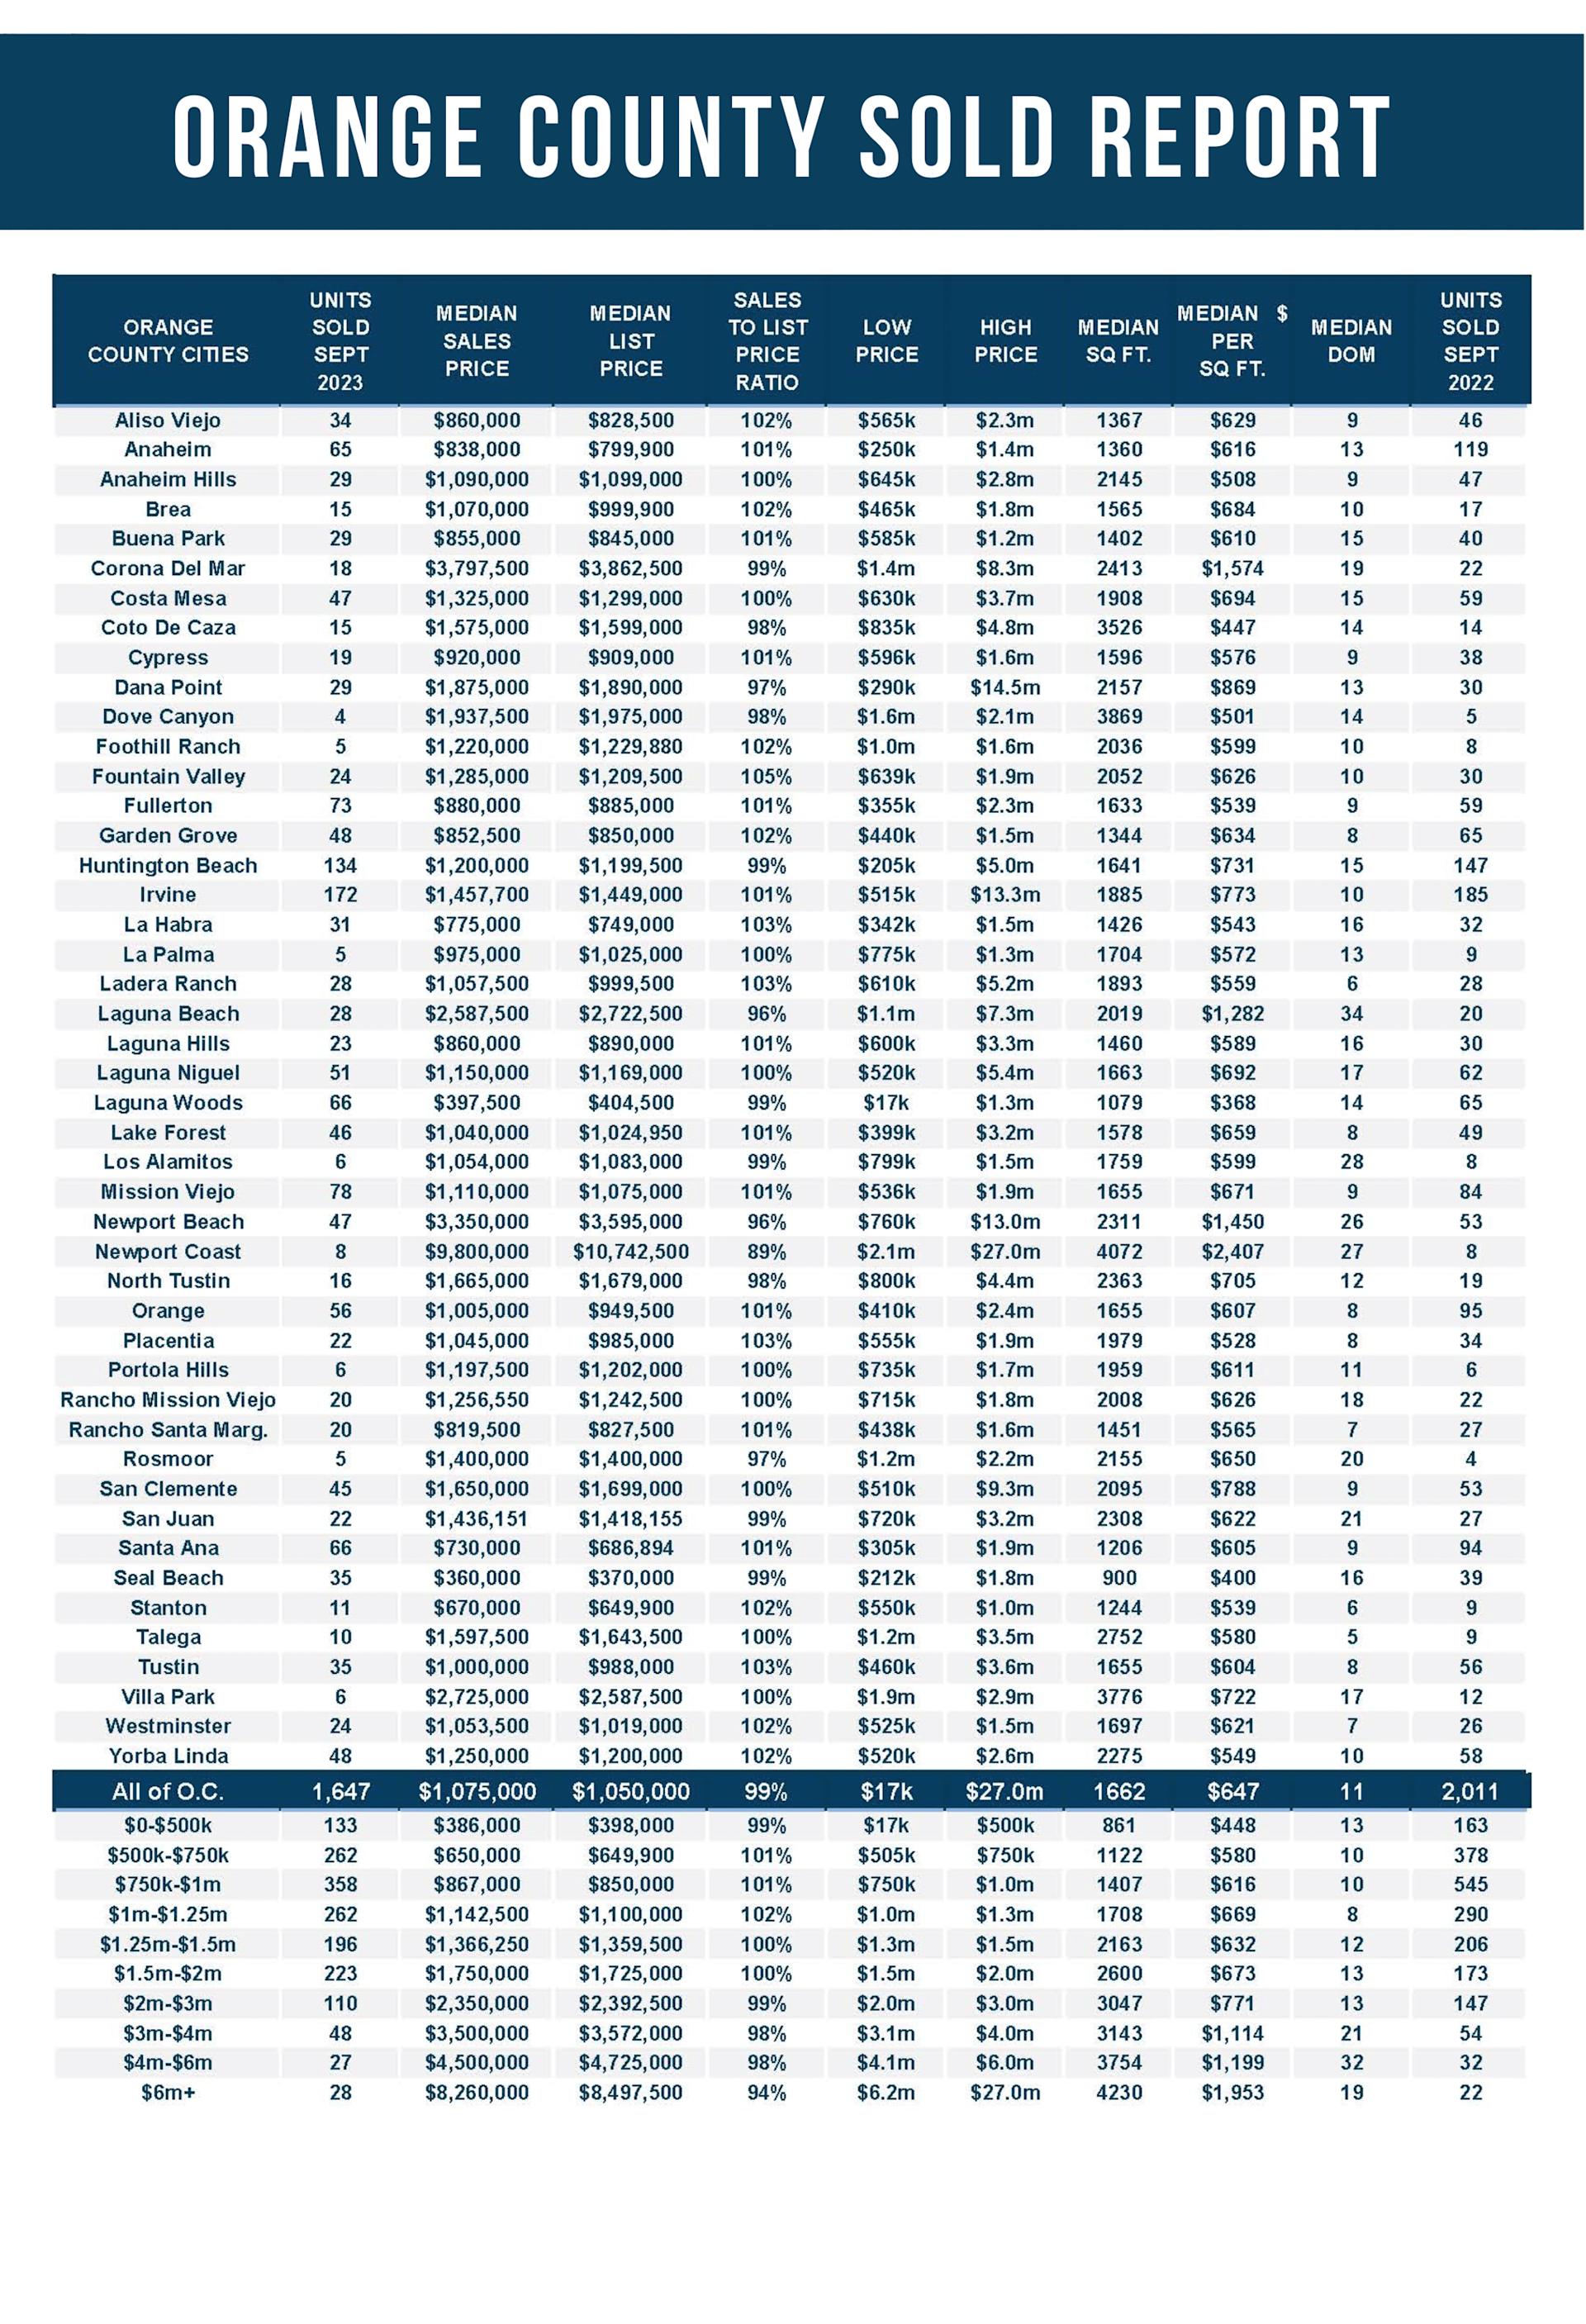
The sales price to last list price ratio is very telling. This refers to the final list price before becoming a pending sale. These are averages, meaning there are exceptions, but the overall trend is stunning. In Orange County, 80% of all closed sales in September did not reduce the asking price. The sales price to last list price ratio for these homes was 100.2%, meaning, on average, a home sold for a fraction higher than the asking price. A house listed at $1 million sold for $1,002,000, $2,000 above the asking price. The median days on the market before becoming a pending sale was only 8, indicating that accurate pricing means way less time on the market.
11% of all closed sales reduced their asking prices between 1% and 4%. The sales-to-last list price ratio for these homes was 97.5%; on average, it took 43 days to become a pending sale. A house that reduced its list price to $1 million sold for $975,000, a considerable $15,000 less than homeowners with no reduction.
For homes that reduced their asking prices by 5% or more, a surprising 9% of closed sales in September, the sales-to-last list price ratio was 95.0% after being on the market for over two months. A home that finally reduced its price to $1 million sold for $950,000. Everybody would agree that closing at $1,002,000 is much better than $950,000, a mind-blowing $52,000 better.
The data is stunning in looking at the sales price to the original list price ratio. This is the price when a home initially comes on the market before any price reductions. For homes that reduced the asking price between 1% and 4%, the sales to original list price ratio was 94.7%. For example, a house listed originally for $1,030,000 had to reduce the asking price to $1 million to find success and ultimately sold for $975,000, a staggering $55,000 less than the original asking price.
Homes that reduced the asking price by at least 5% had a sales-to-original list price ratio of 84.7%. A house initially listed at $1,122,000 had to lower the asking price, often more than once, to $1 million to find success, and ultimately sold for $950,000. That is an overwhelming $172,000 less than the original asking price.
This is the age of smart devices where buyers have downloaded apps with notifications every time a home comes on the market. Upon receiving these notifications, buyers eagerly review all the details, look at every picture, and decide on the spot whether or not they want to see it. They factor in the amenities, condition, location, upgrades, and price in making their decisions. Buyers are smart. After carefully observing all activity within their price range, they become acutely aware of price. They know if a home is within the ballpark of its Fair Market Value or whether it is too high. Many buyers will avoid homes where sellers are stretching the asking price. In a housing market with 8% mortgage rates, buyers are NOT willing to stretch in price.
Overpriced homes ultimately sit without success until they adjust the asking price. Buyers receive notifications from their housing apps that alert them to price reductions. The buyer knows exactly how much the home has been reduced. Unfortunately, homes with price reductions do not obtain the same fanfare as when they initially came on the market. The hype is gone. The anticipation is gone. Even if a buyer did not see the home in person, they felt like they had seen it because they had viewed all the pictures and videos and read the text. Buyers are not eager to see a home that has been reduced. Ultimately, it receives fewer showings than when it initially came on the market. Fewer showings translate to fewer offers and a lower sales price.
Before coming on the market, sellers must ask, “Is the price right?” Will it sell in 8 days with plenty of action? There is more activity in the initial two weeks than at any other time during the marketing process. Or will they have to adjust the asking price and sit on the market for over two months with much less fanfare? In a housing market with 8% mortgage rates, the pressure to price a home appropriately out of the gate is more crucial now than at any other time this year. Carefully and methodically arriving at a home’s Fair Market Value will allow a seller to achieve the best outcome and walk away with the most money.
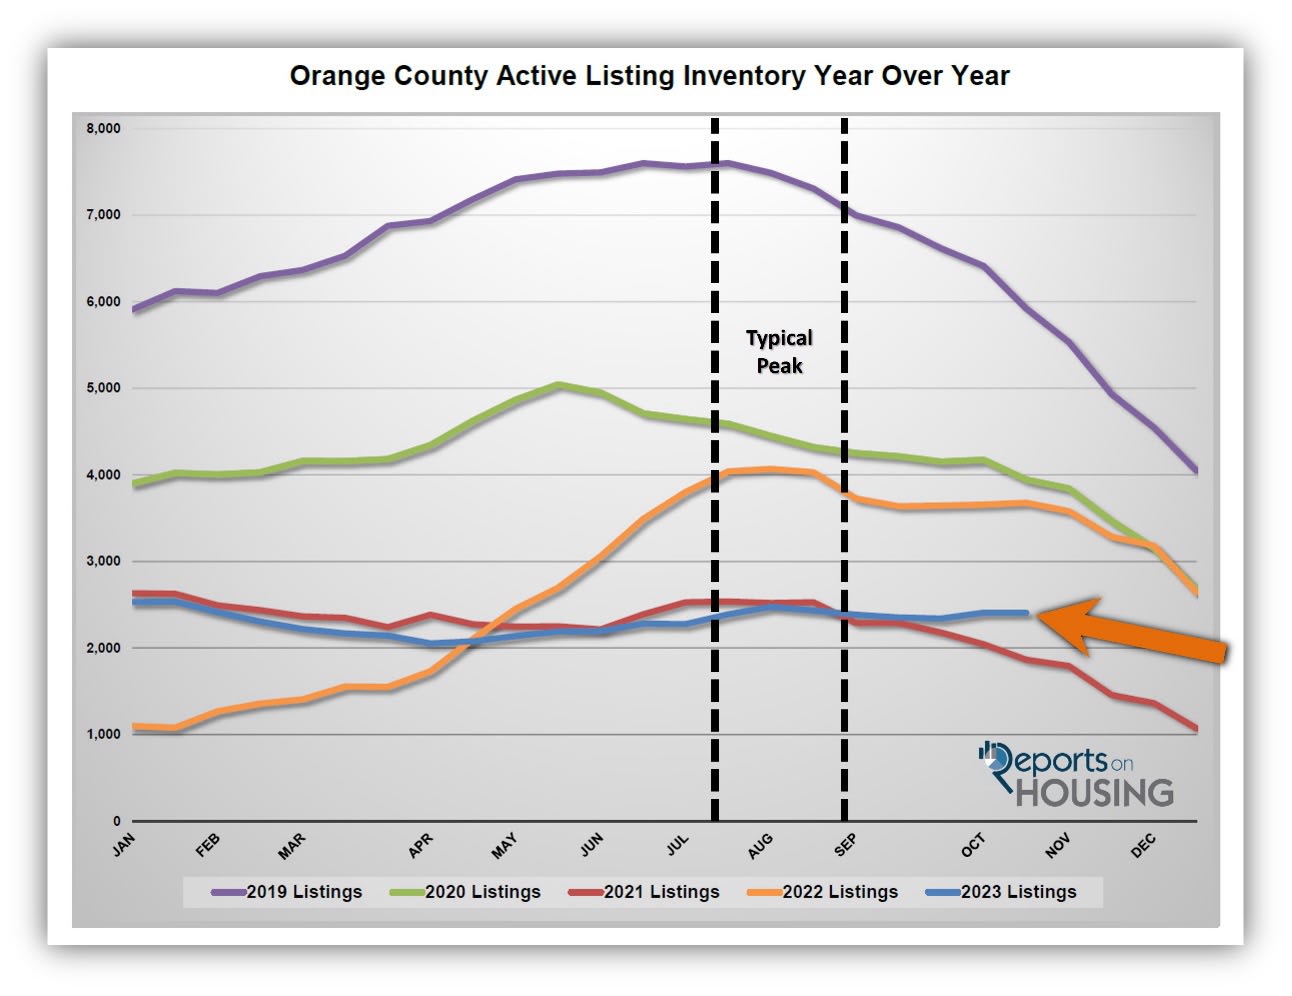
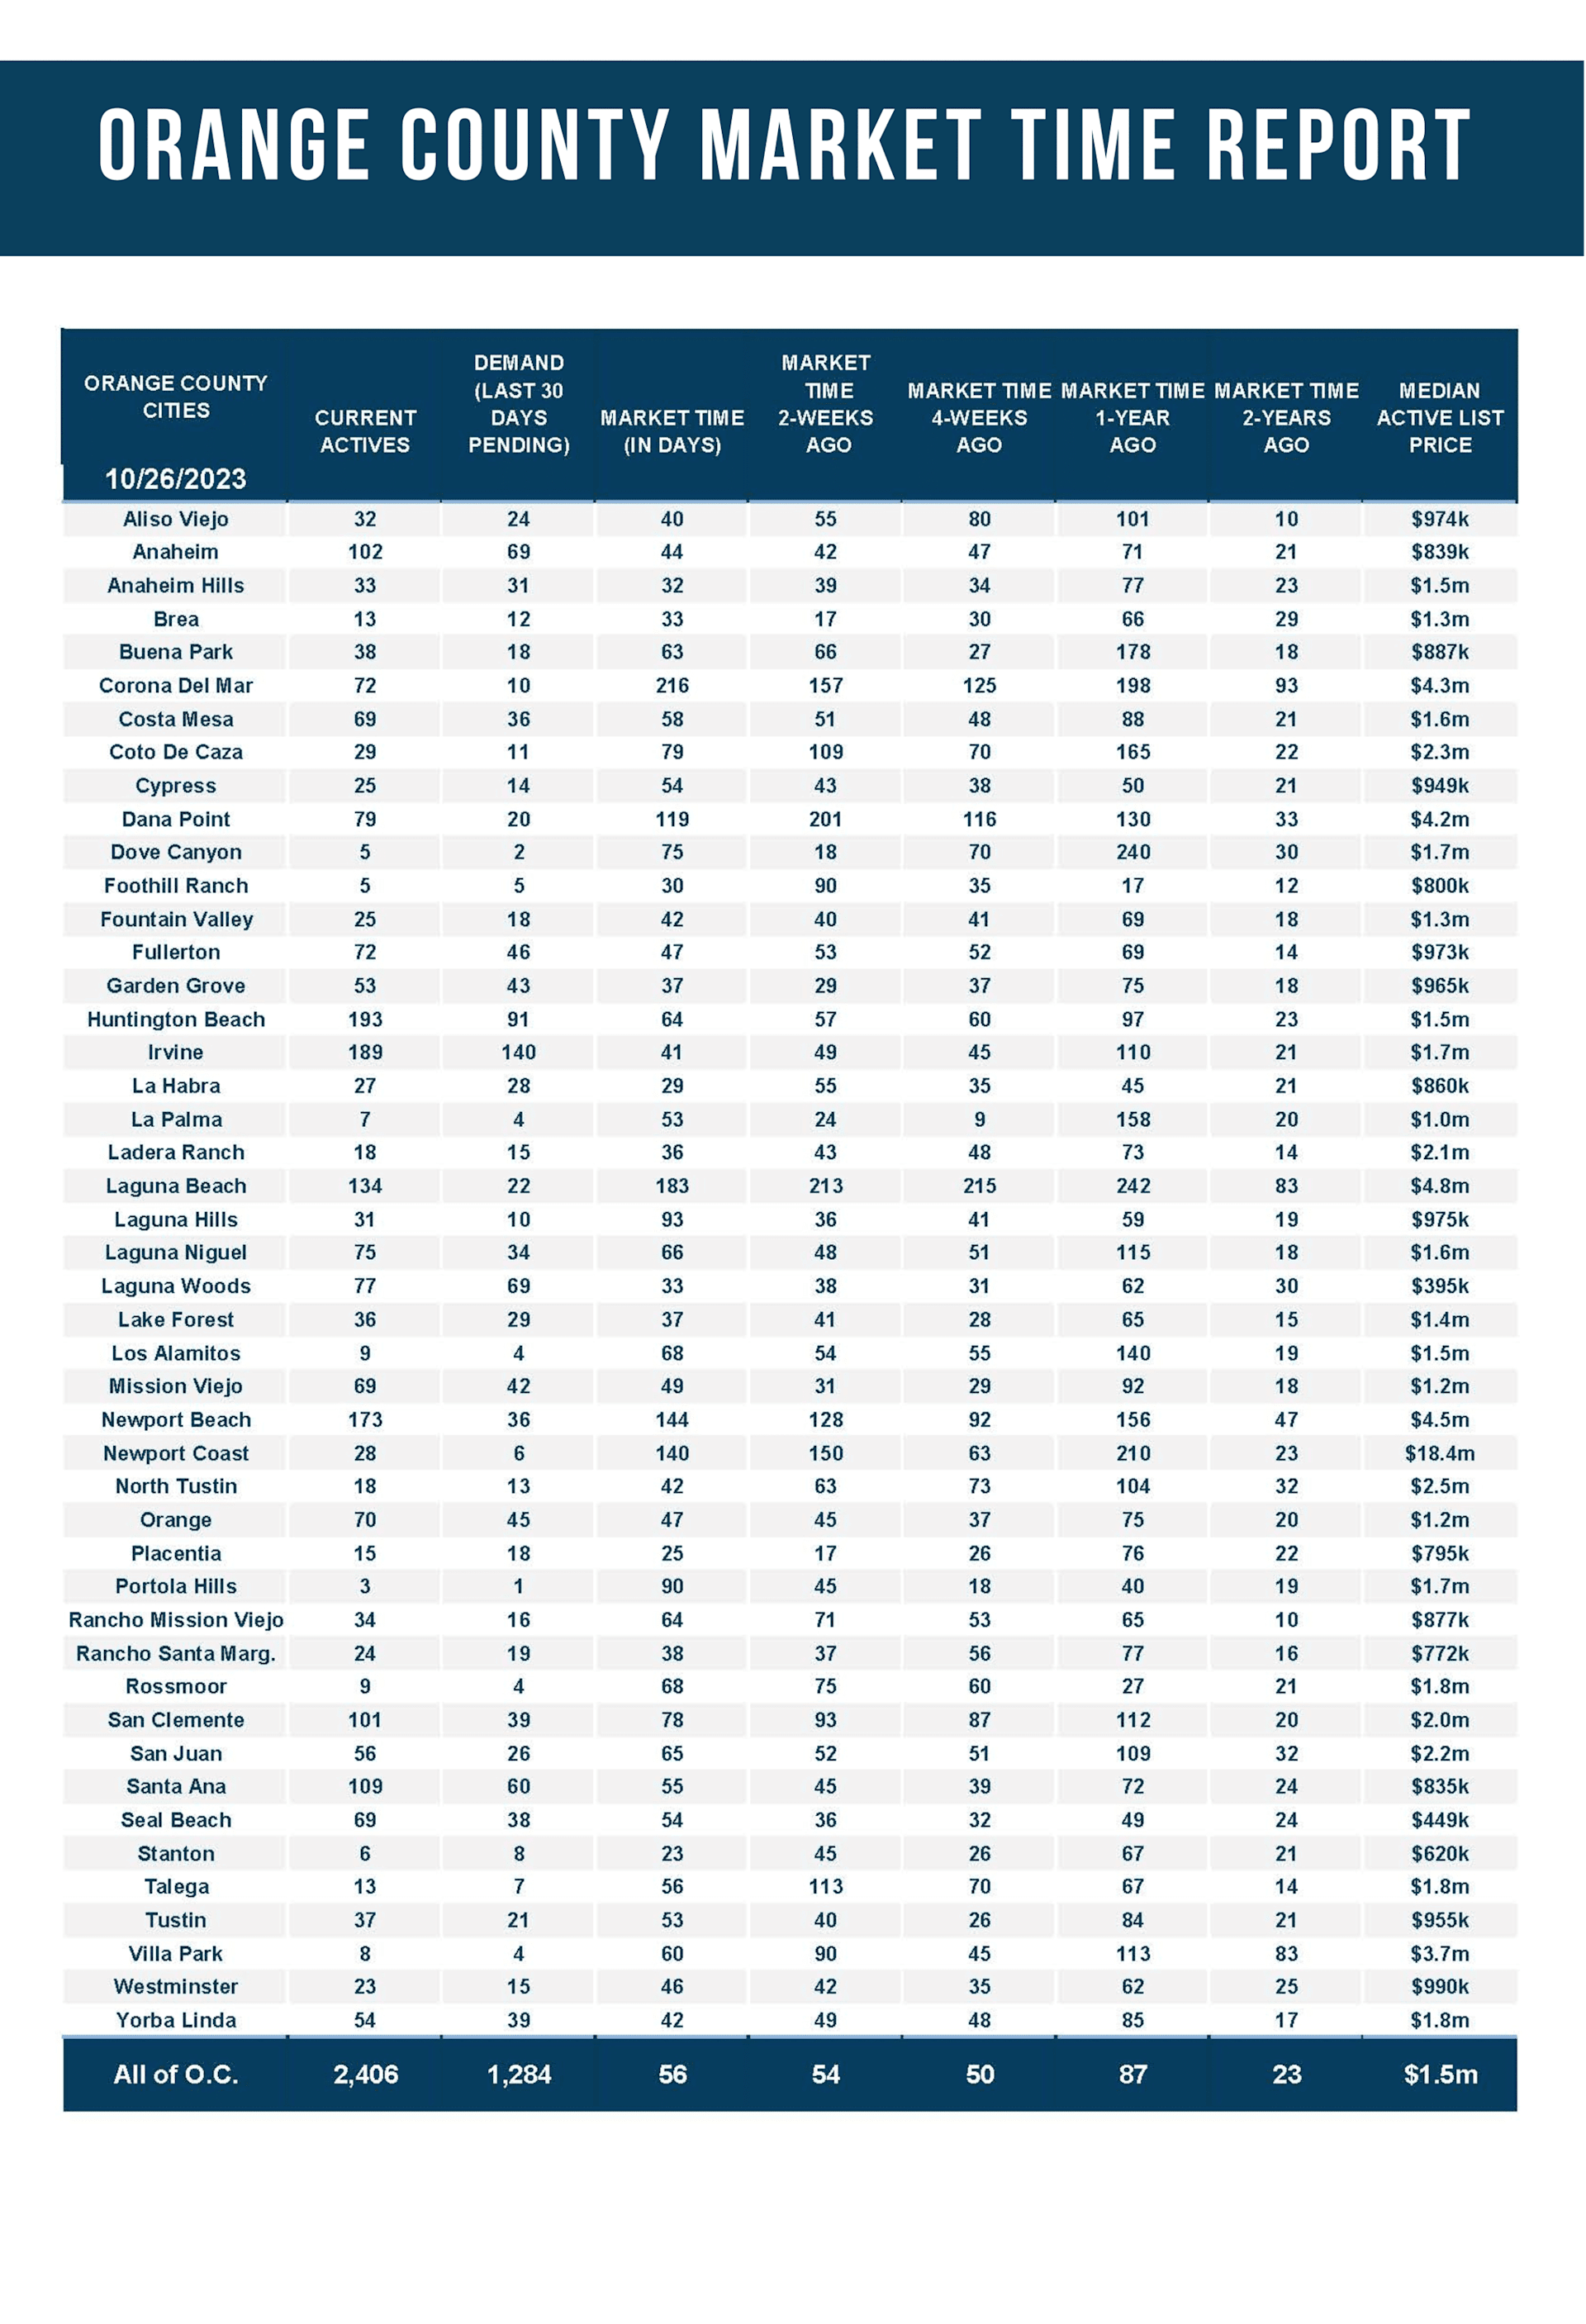
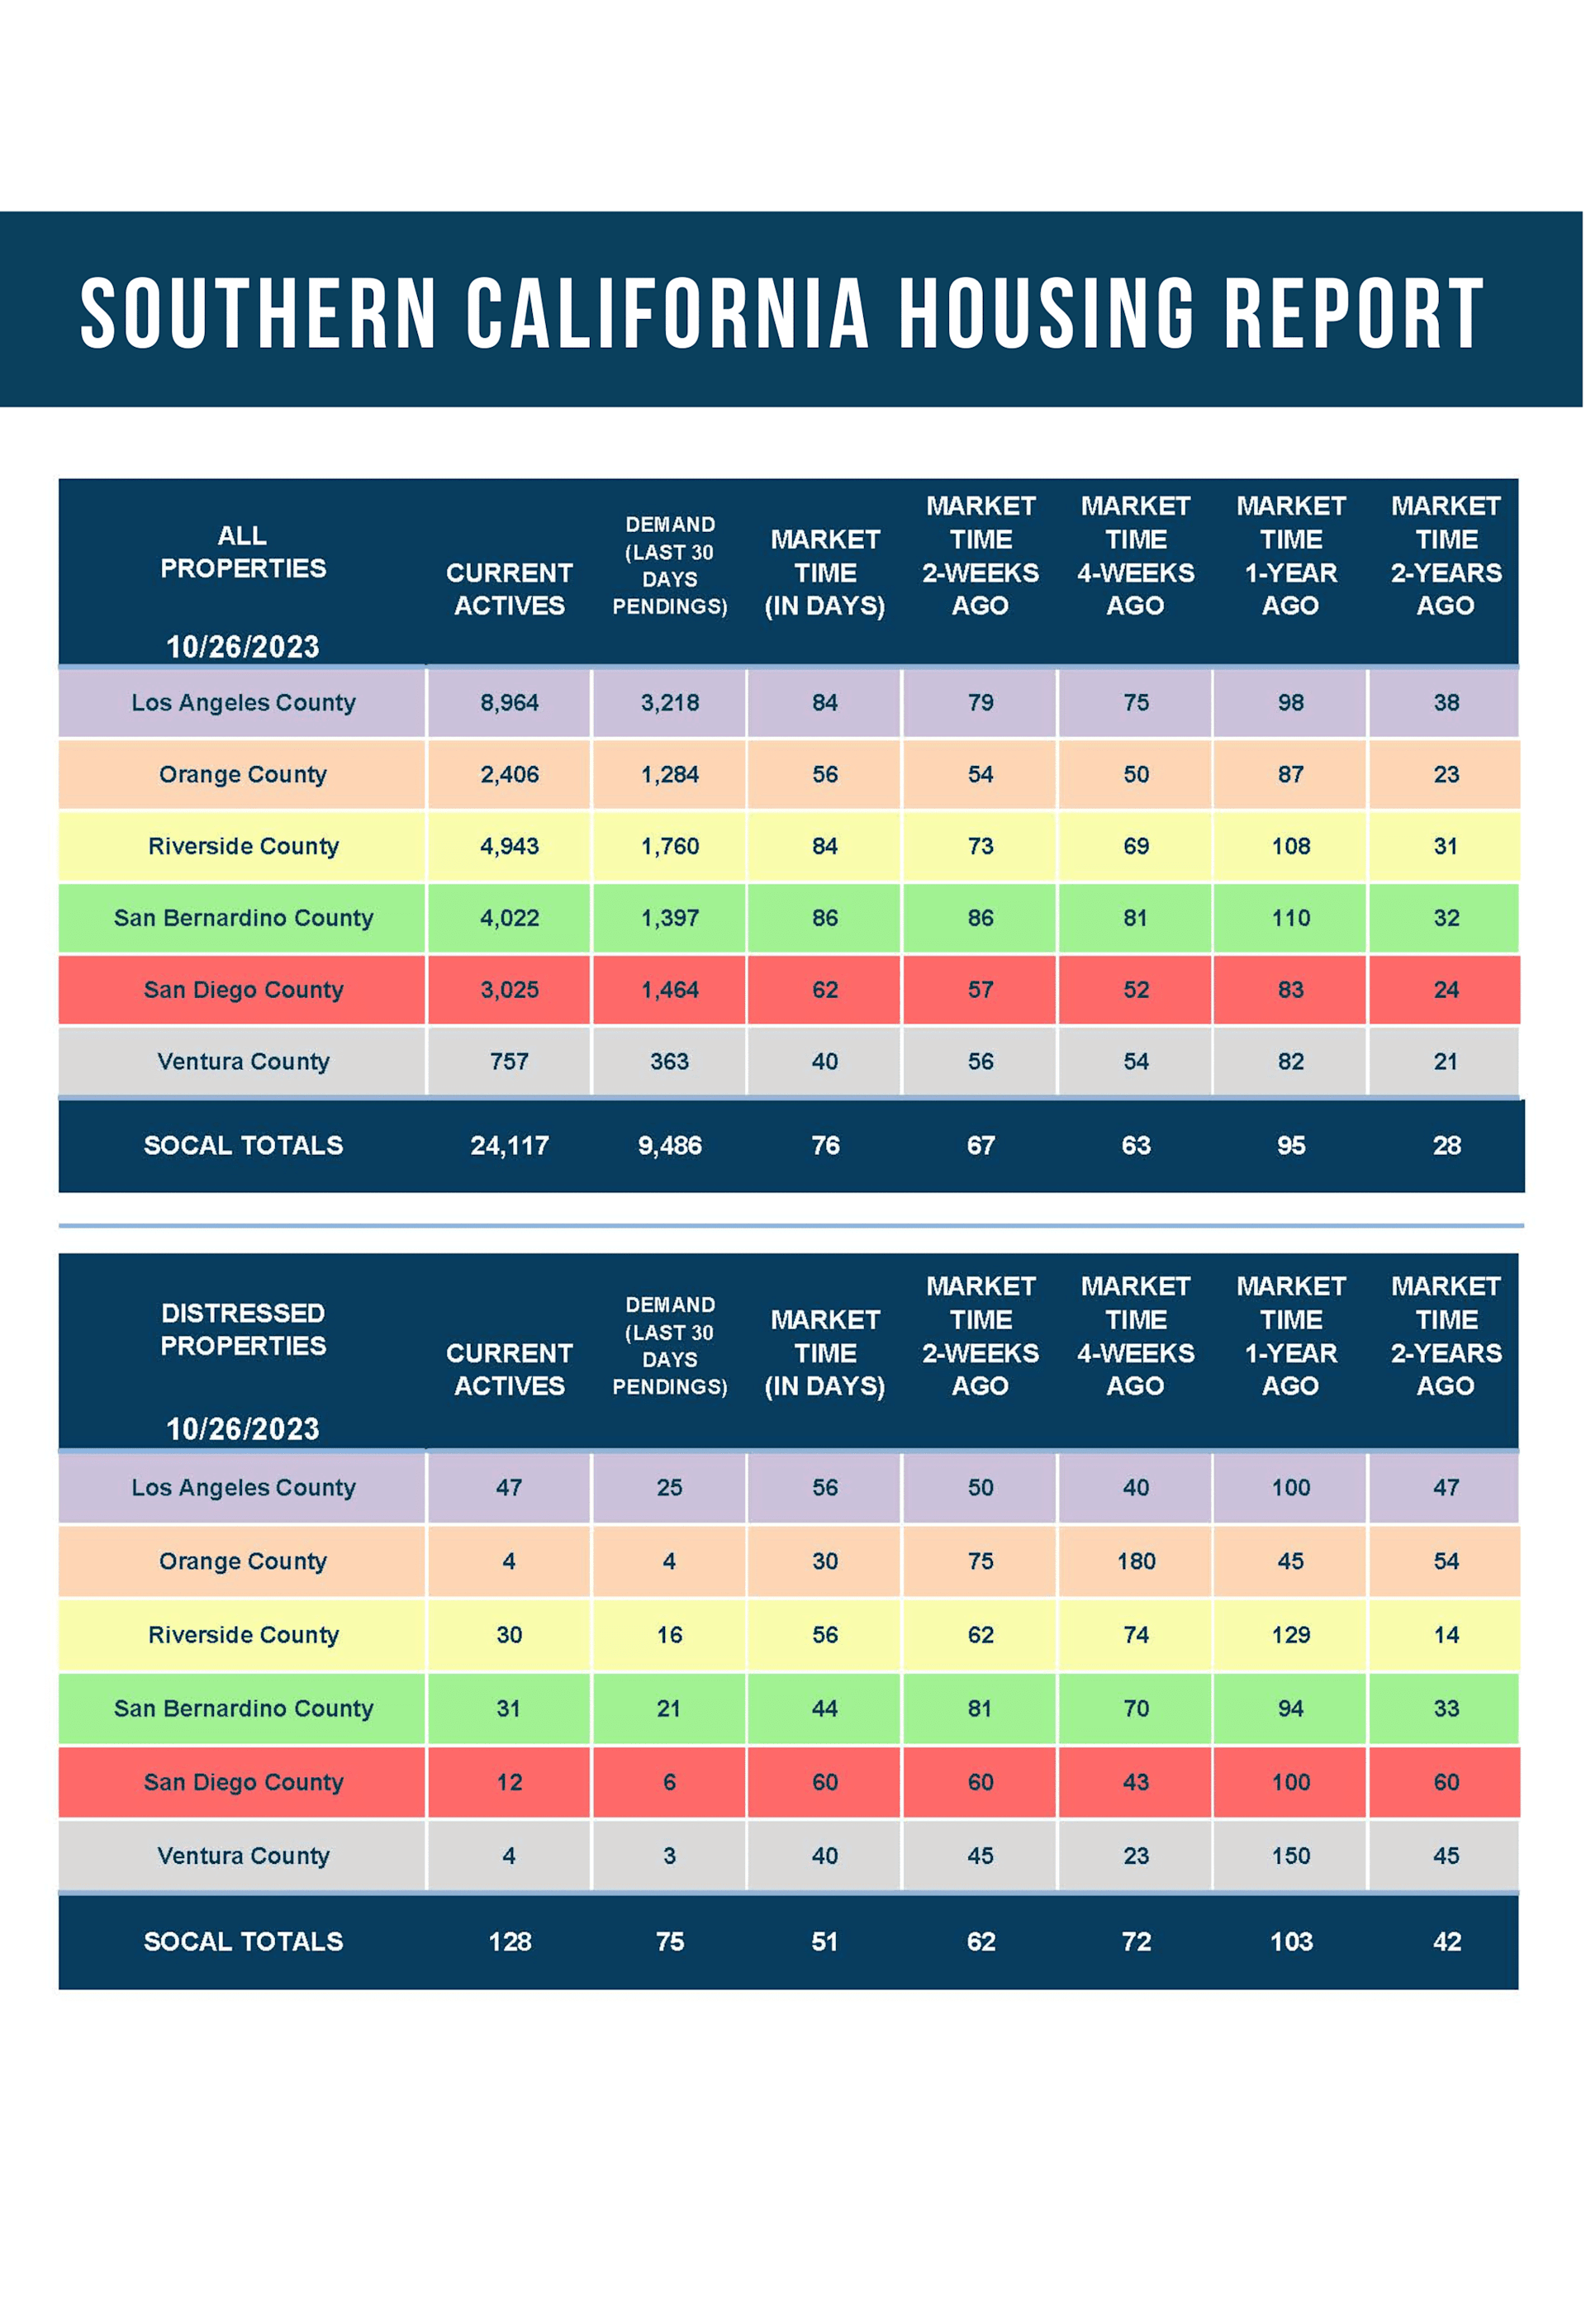
The active inventory did not change much in the past couple of weeks.
The active listing inventory decreased by two homes in the past two weeks, nearly unchanged, and now sits at 2,406 homes. Typically, during the Autumn Market, the active inventory slowly drops along with demand, but not this year. Due to increasing mortgage rates, rising from 7% at the end of July to nearly 8% today, the pool of potential buyers has dwindled a bit further. The muted demand has resulted in the inventory not dropping like it usually does; instead, it has remained relatively flat since peaking at the start of August at 2,475 homes, only 69 more homes than today.
The inventory is poised to drop in the coming weeks as housing transitions to the Holiday Market. The fewest homes come on the market in December, and the second-fewest homes come on in November. Many unsuccessful sellers pull their homes off the market so they can enjoy the holidays, placing their selling goals on hold until next year. As a result, the inventory plunges until ringing in the New Year.
Last year, the inventory was 3,677 homes, 53% higher, or 1,271 more. The 3-year average before COVID (2017 through 2019) is 6,010, an additional 3,604 homes, or 150% extra, more than double where it stands today.
Homeowners continue to “kick back” in their homes, unwilling to move due to their current underlying, locked-in, low fixed-rate mortgage. For September, 1,915 new sellers entered the market in Orange County, 1,114 fewer than the 3-year average before COVID (2017 to 2019), 37% less.
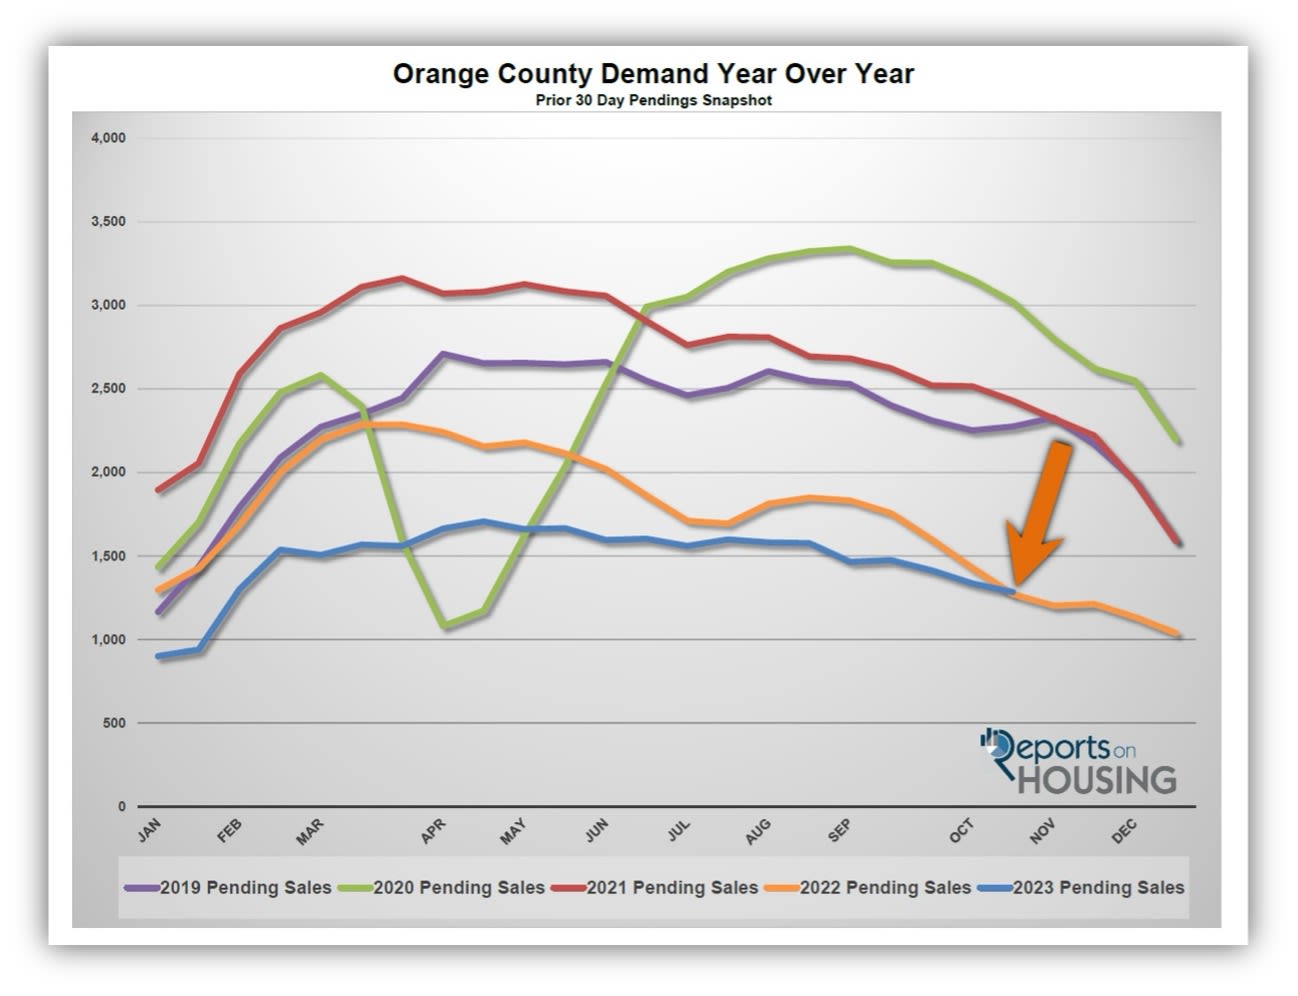
Demand is higher than the prior year for the first time since June 2021.
Demand, a snapshot of the number of new pending sales over the prior month, decreased from 1,335 to 1,284 in the past couple of weeks, down 51 pending sales, or 4%, its lowest level since January. It is also the lowest October reading since 2007. Nonetheless, it is the first time there have been more pending sales than the prior year since June 2021. Today’s interest rates are not helping demand. Many potential buyers are priced out of the market as rates rise. Across the country, 5 million Americans can no longer afford to purchase a home as rates climbed from 7% to 8% in the past few months. Until rates fall, fewer buyers can search for a home. Expect demand to continue to drop from now through the end of the year when it will reach its lowest reading for 2023.
Last year, demand was at 1,270, 1% lower than today, or 14 fewer. The 3-year average before COVID (2017 to 2019) was 2,180 pending sales, 70% more than today, or an additional 896.
With demand falling faster than supply, the Expected Market Time (the number of days to sell all Orange County listings at the current buying pace) increased from 54 to 56 days in the past couple of weeks, its highest level since the start of February. Last year, the Expected Market Time was 87 days, slower than today. The 3-year average before COVID was 85 days, also slower than today.
The luxury market improved slightly in the past couple of weeks.
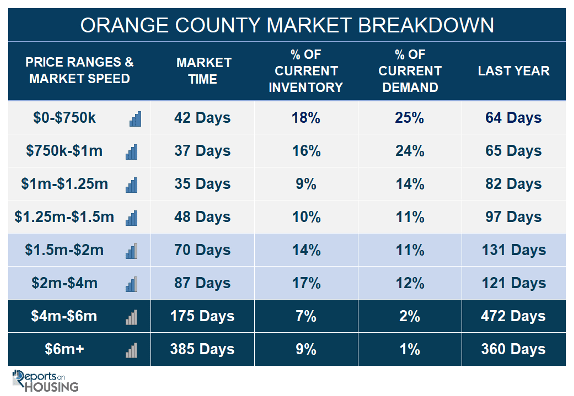
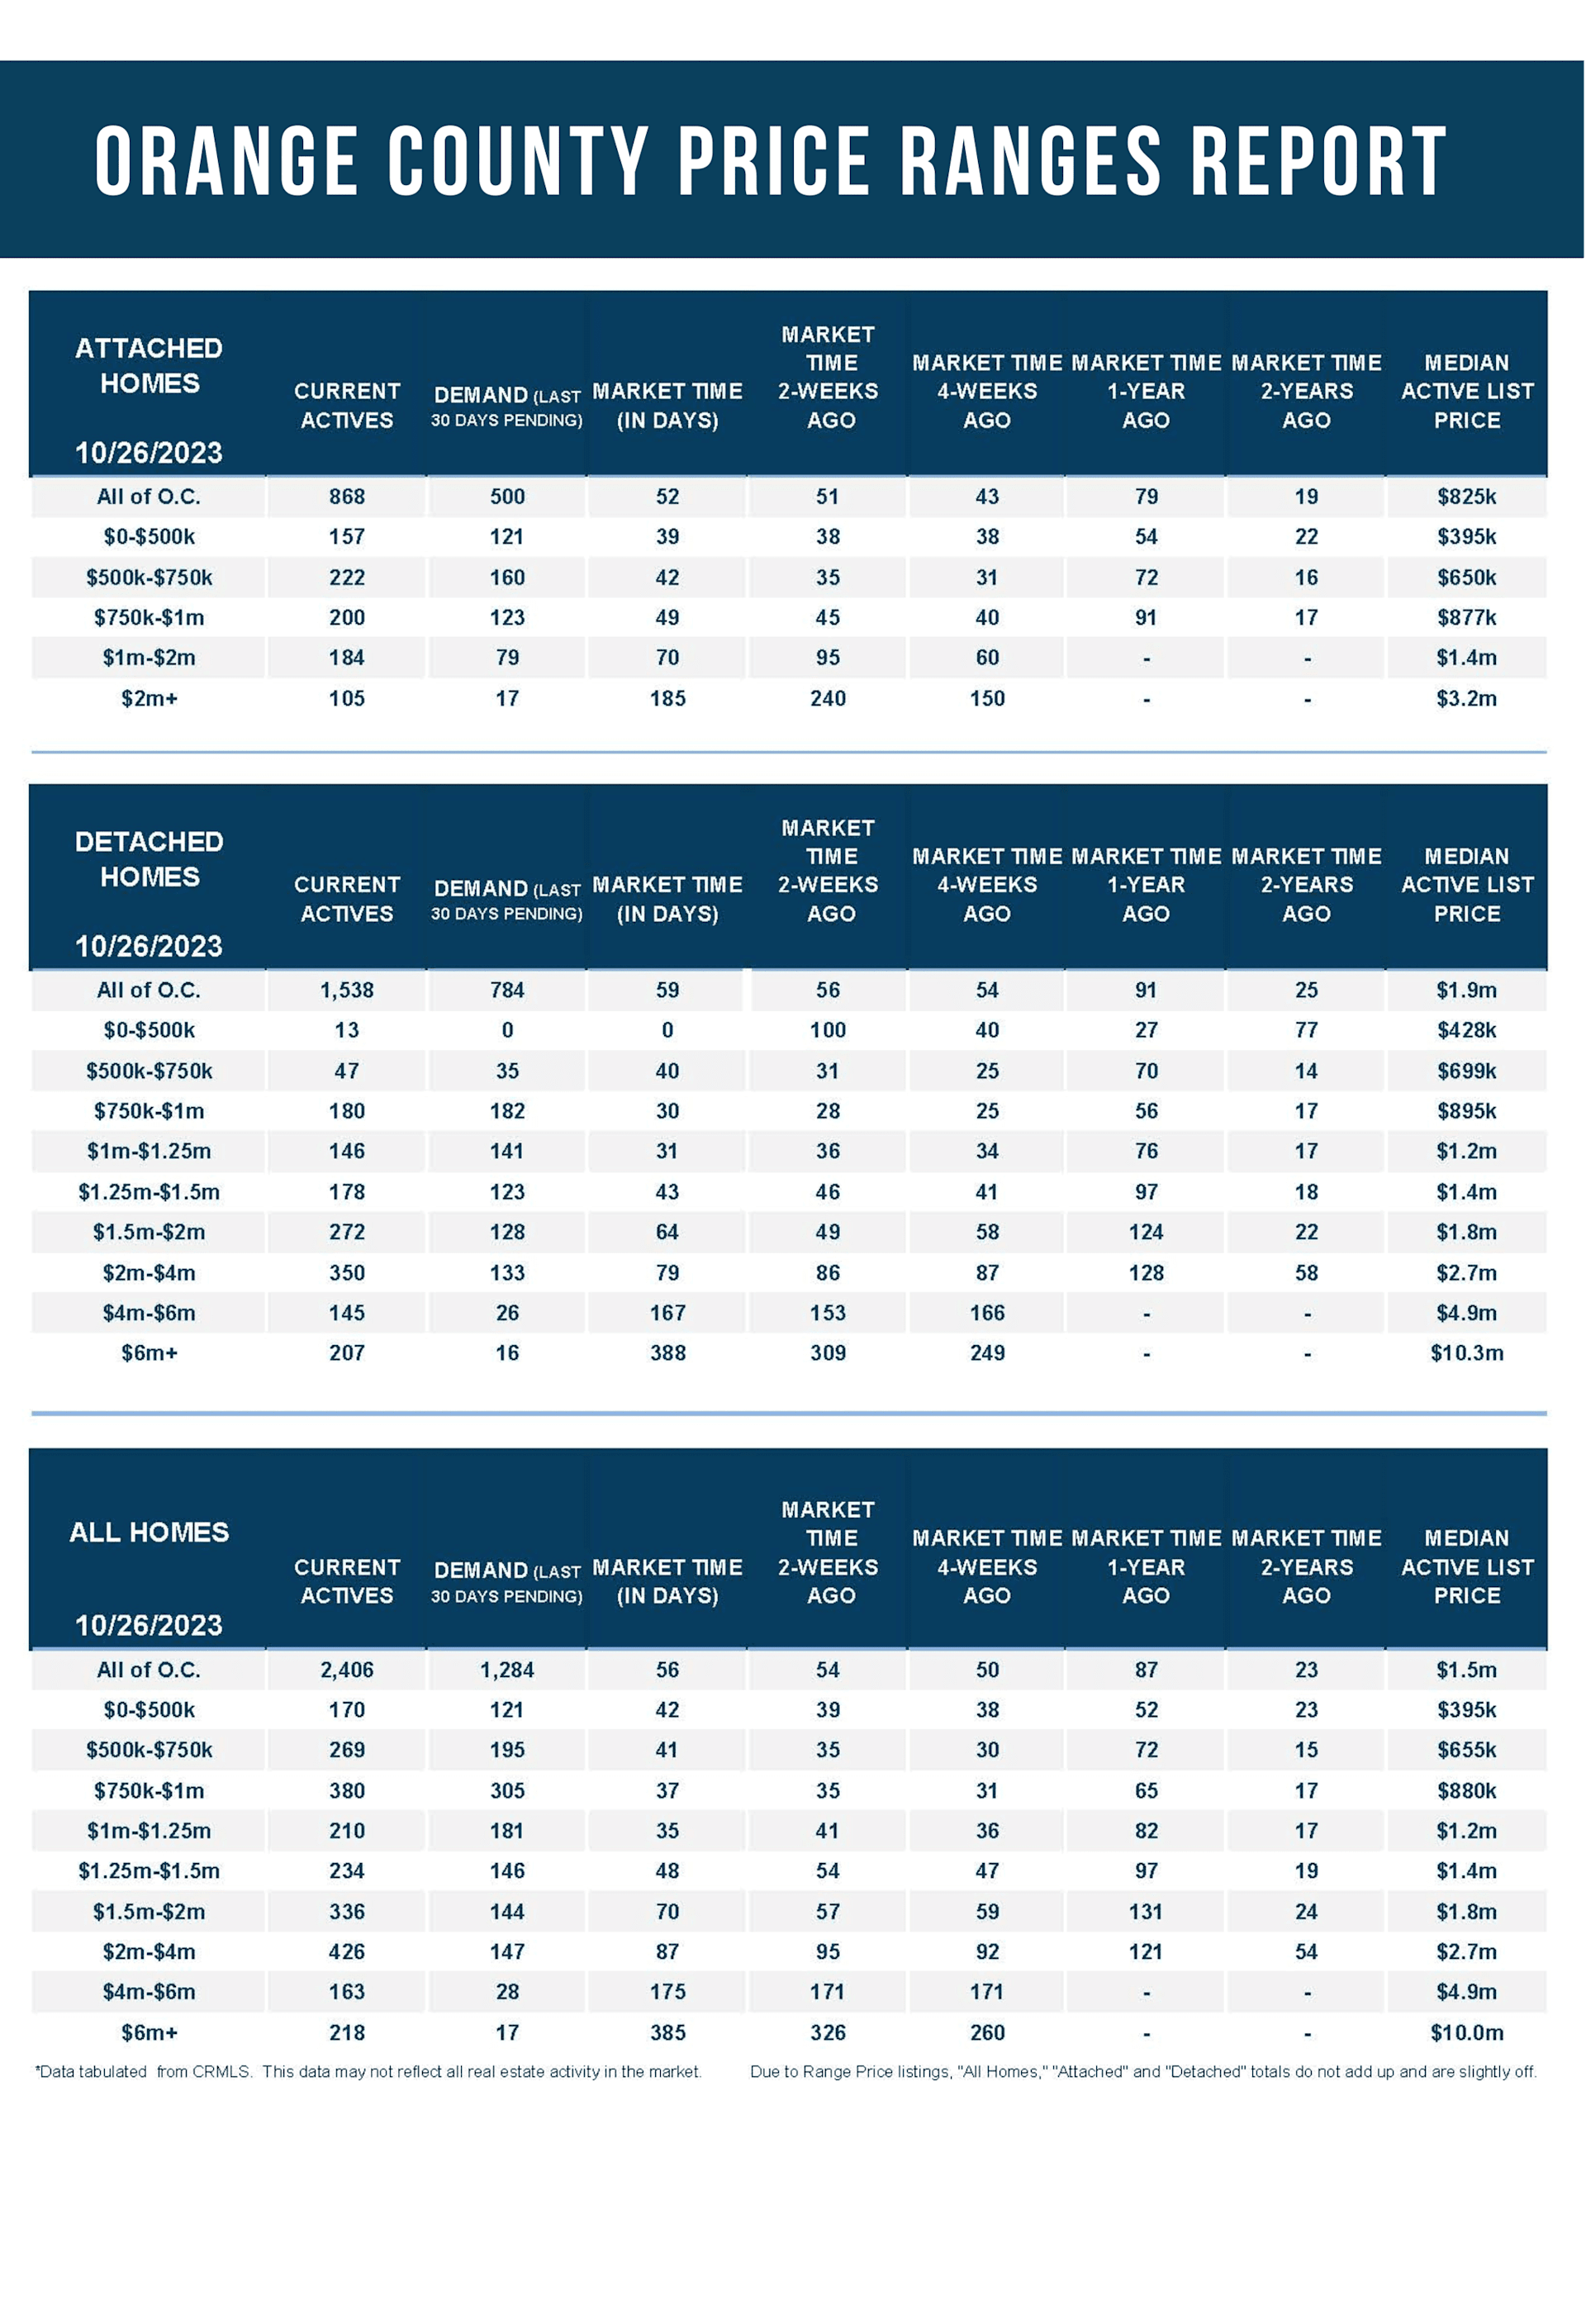
In the past couple of weeks, the luxury inventory of homes priced above $2 million decreased from 810 to 807 homes, down three, nearly unchanged. Luxury demand increased by seven pending sales, up 4%, and now sits at 192. With inventory almost unchanged and demand rising slightly, the Expected Market Time for luxury homes priced above $2 million decreased from 131 to 126 days. Yet, at 126 days, the luxury market is much more sluggish than the lower ranges, and luxury sellers must carefully approach the housing market.
Year over year, luxury demand is up by 66 pending sales or 52%, and the active luxury listing inventory is up by 80 homes or 11%. Last year’s Expected Market Time was 173 days, slower than today.
For homes priced between $2 million and $4 million, the Expected Market Time in the past two weeks decreased from 95 to 87 days. For homes priced between $4 million and $6 million, the Expected Market Time increased from 171 to 175 days. For homes priced above $6 million, the Expected Market Time increased from 326 to 385 days. At 385 days, a seller would be looking at placing their home into escrow around November 2024.