Even though the housing market is hot once again, many
buyers have been pushed to the sidelines due to the high
mortgage rate environment.
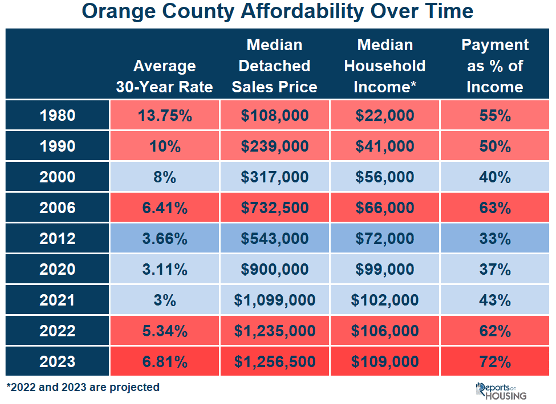
Today’s monthly payment is 72% of the median household’s monthly income at the current rate and median detached sales price.
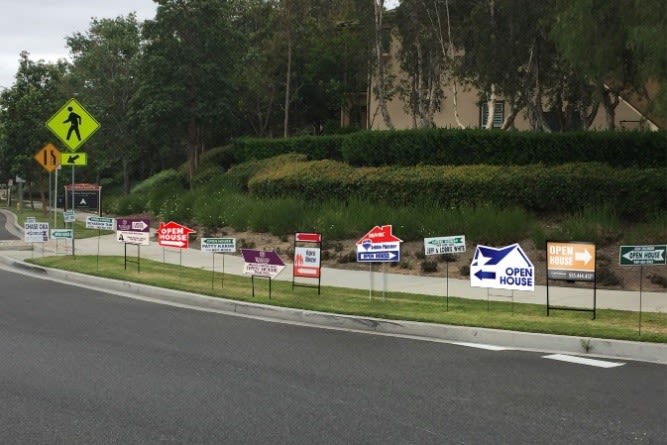
This year’s housing market is booming despite the higher mortgage rate environment. Open houses are lined with buyers. Bidding wars have returned, along with homes selling above their asking prices. Housing is crazy once again. To many, it seems as if more buyers are looking to purchase today than before the pandemic, or very similar to the COVID years of the second half of 2020 through the first several months of 2022. Yet, the actual number of buyers in the marketplace is far fewer than many realize. How can that be?
It is as if Disneyland decided to limit attendance to 50% of its average summer ticket sales. Park attendees would expect to walk on just about every ride. But once they enter the “Happiest Place on Earth,” they quickly find that only half the attractions are open, and the lines are just as long as a typical summer day. That is precisely what is going on in the housing market today. With rates at nearly 7% and affordability at tragically low levels, buyers would expect to take their time as homes for sale sit and sellers anxiously wait for any purchase offer to come in. However, there is a catastrophically low number of homes available, resulting in buyers competing to purchase.
Today’s Orange County housing market is characterized by a lack of affordability, low demand, a limited number of homeowners willing to sell their homes, and an extremely anemic inventory. To understand why buyer demand is weak, it is essential to consider where interest rates, incomes, and home prices have been over time and their impact on affordability. Interest rates have been higher than they currently stand today, but that does not mean it was more unaffordable. In 1980, the average mortgage rate was 13.75%, the median income was $22,000, and the median detached sales price was $108,000. That meant the monthly housing payment was 55% of the median household income. Rates continued to drop, and incomes climbed decade after decade. In 2000, mortgage rates were at 8%, the median income more than doubled in 20 years, rising to $56,000, and the median detached sale price climbed to $317,000. Yet,
the monthly payment was only 40% of the median income. It ballooned to 63% in 2006, just before the start of the Great Recession, and dropped to 33% in 2012 as housing began to climb again. In 2020 and 2021, even as the median price of a home had soared to record levels, the monthly payment was at 37% and 43% due to historically low mortgage rates and a median household income that nearly doubled again in 20 years. Affordability was not an issue as mortgage rates had dropped to record lows.
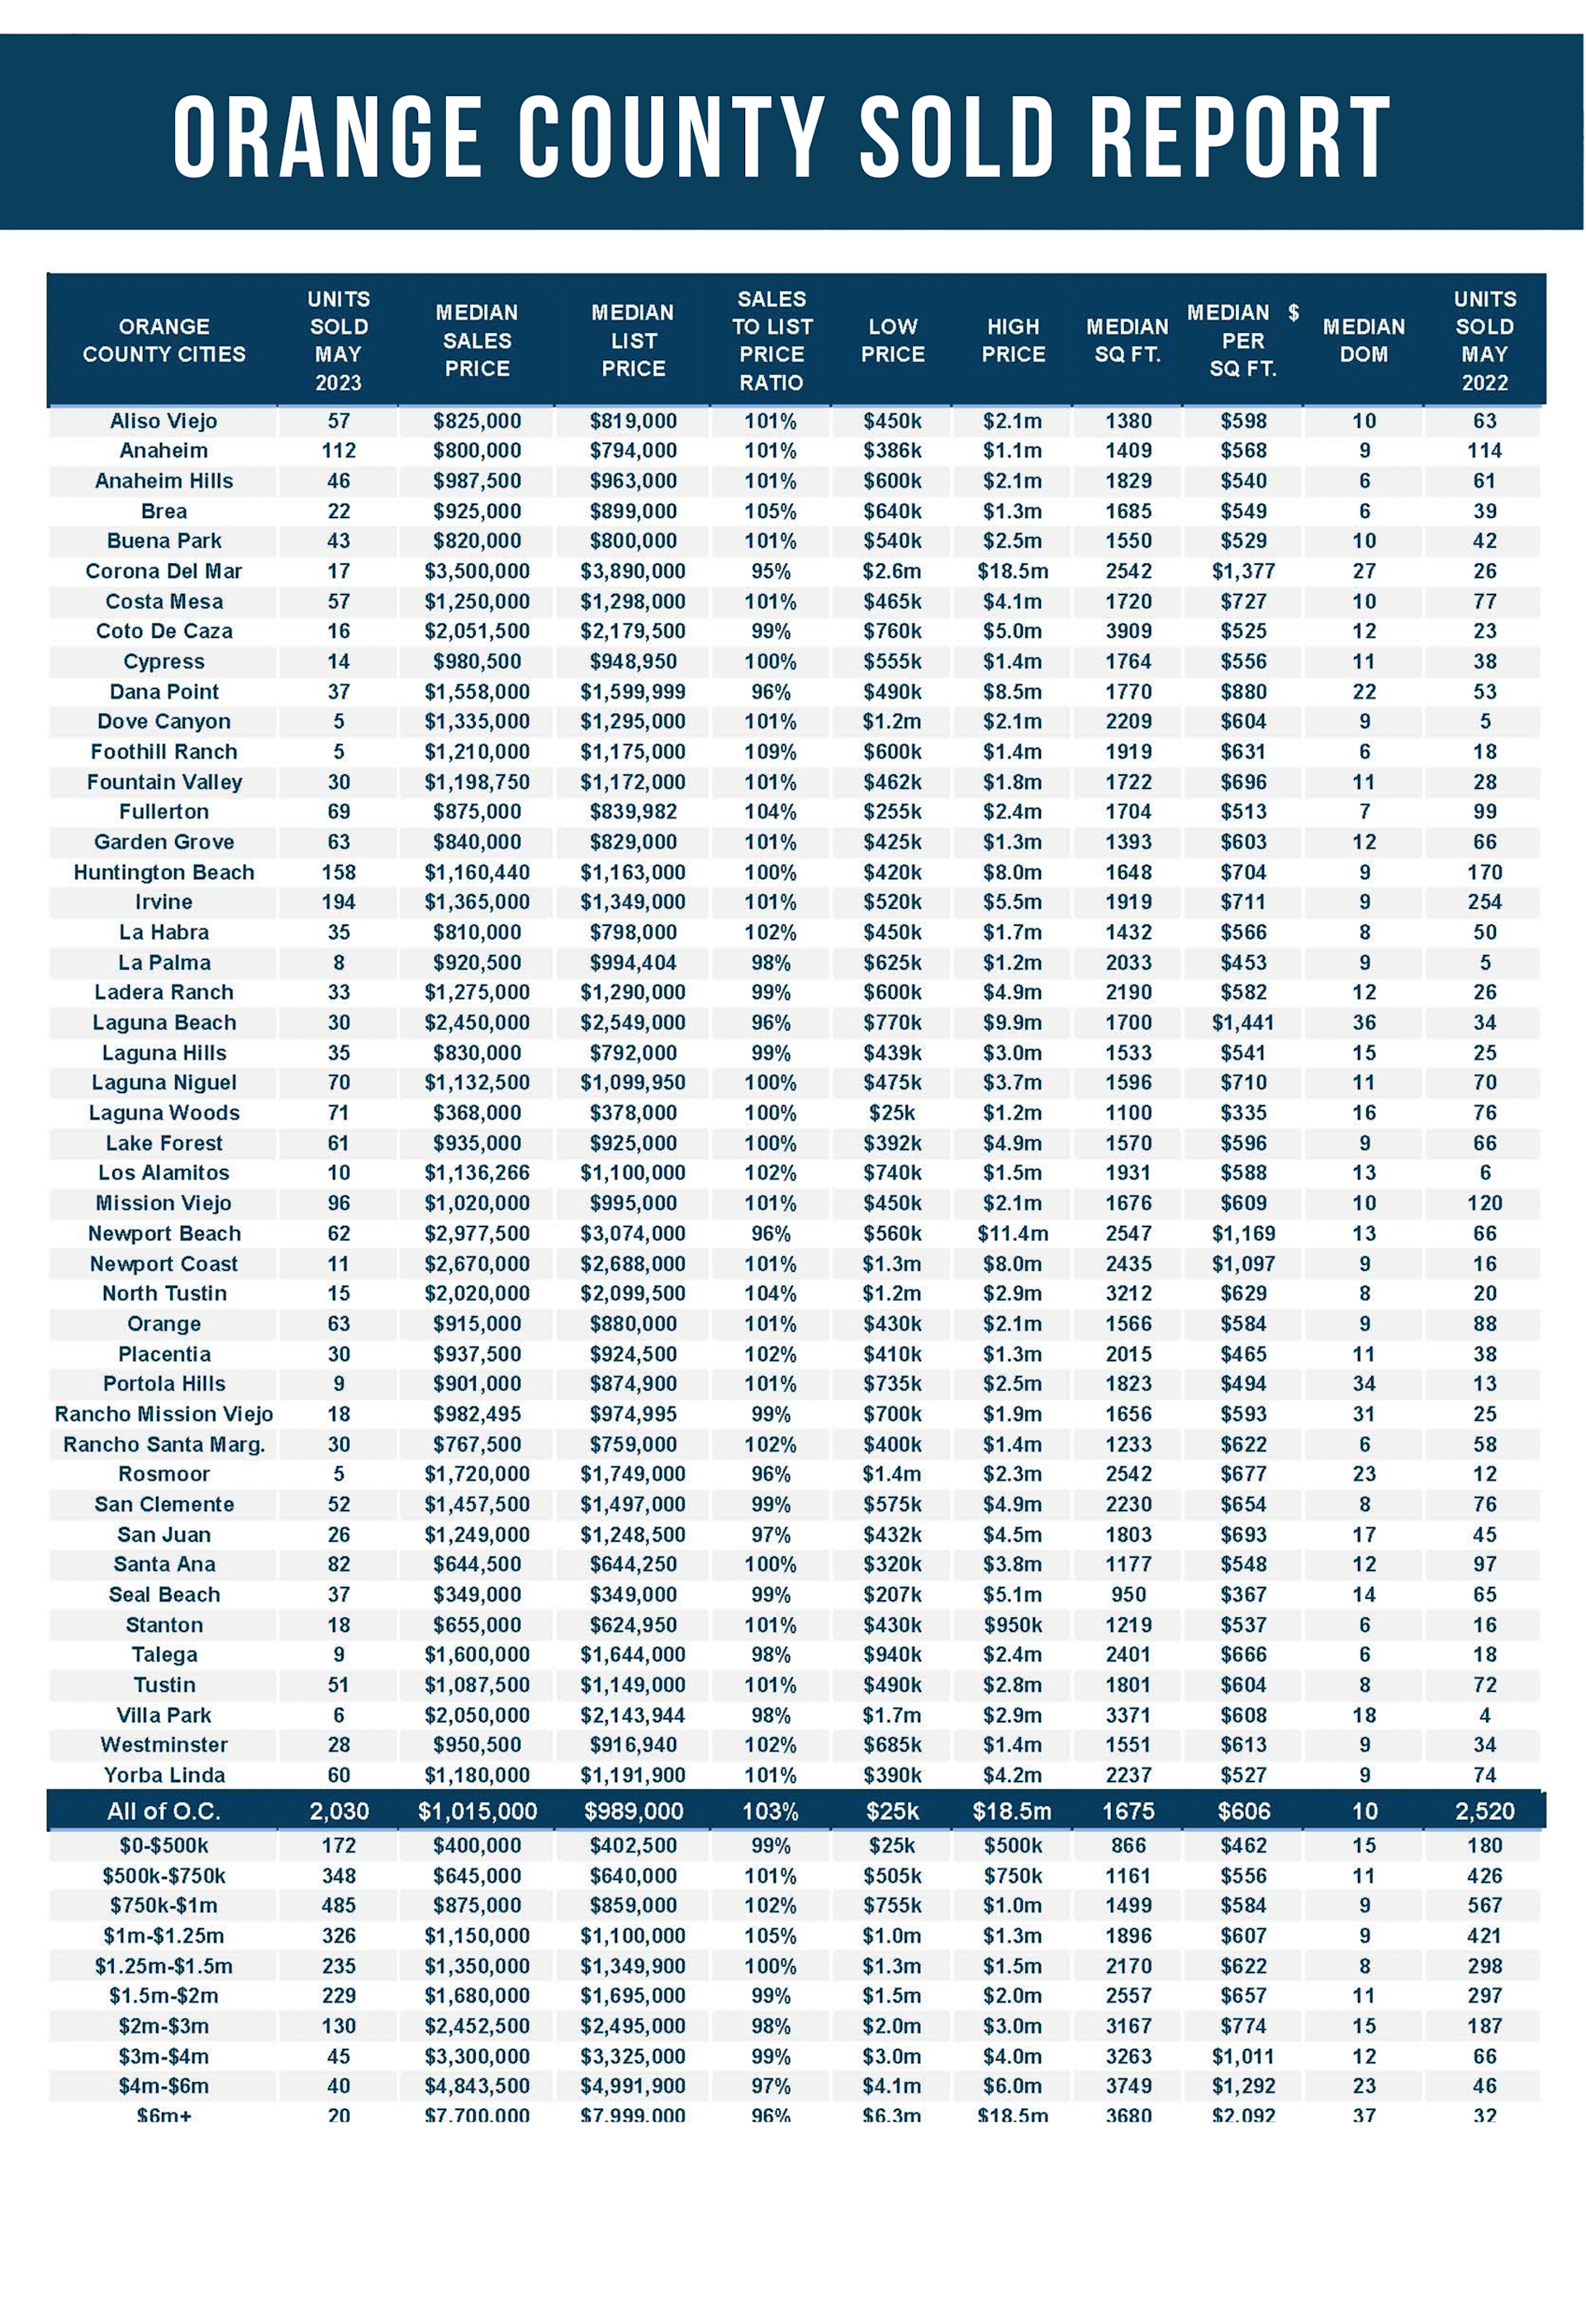
That changed in 2022 when mortgage rates soared and averaged 5.34% for the year, and eclipsed 7% in October and November, climbing to 20-year highs. As a result, the monthly payment for the $1,235,000 home was 62% of the median household income. According to Freddie Mac’s Primary Mortgage Market Survey®, rates rose to 6.81% last week, and the California Association of REALTORS® reported that May’s median detached home increased to $1,256,500 for Orange County in May. An astounding 72% of the median household income would be devoted to paying the monthly payment. Only buyers with incomes that far exceed the median or buyers with cash in the bank are able to purchase today. Home affordability is at record lows.
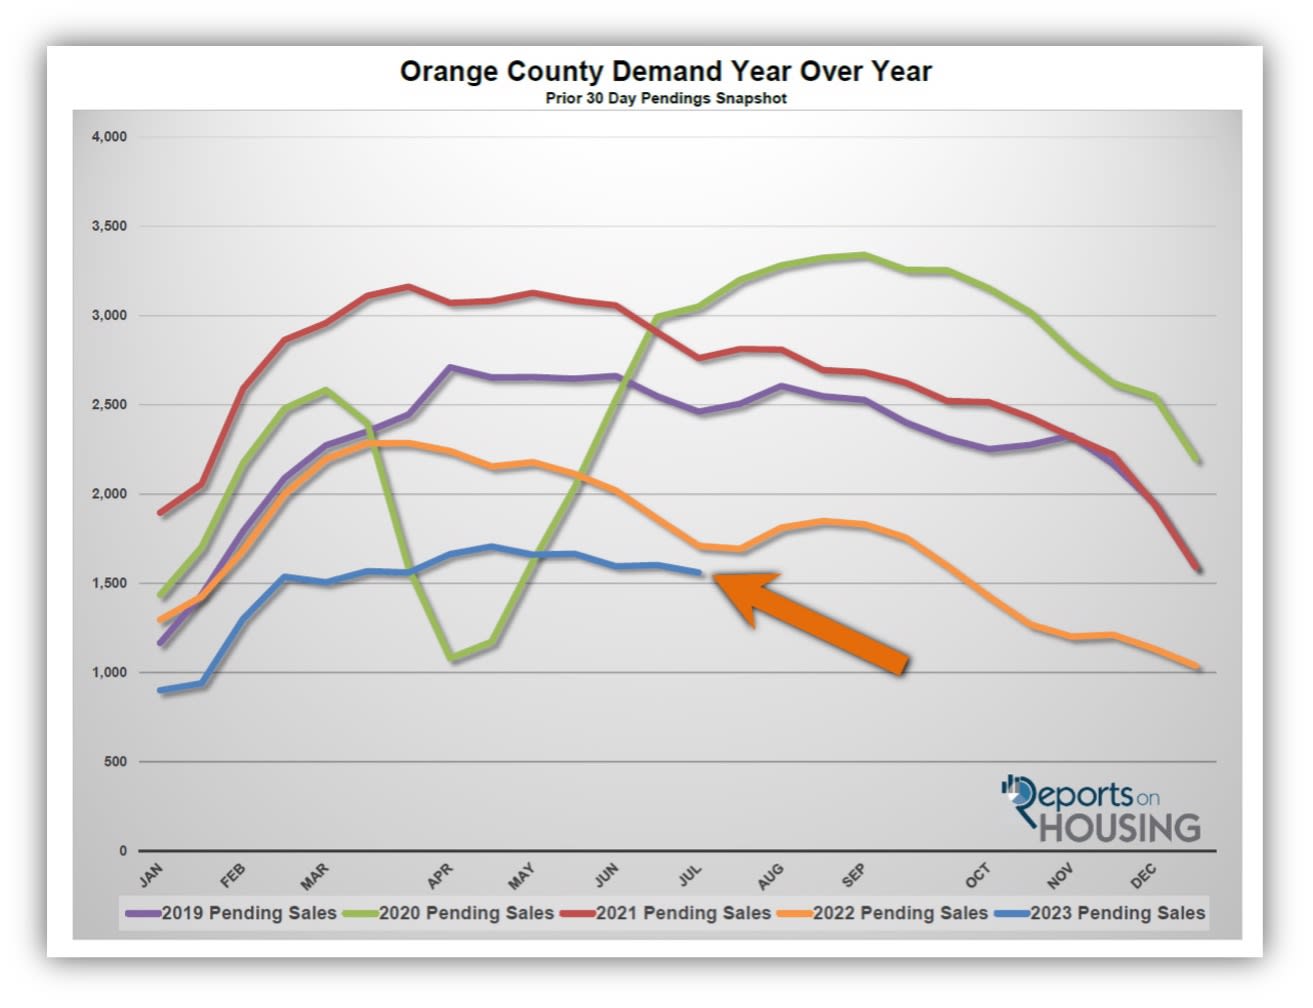
Demand, a snapshot of the number of new pending sales over the prior month, is at 1,560, the lowest for a start to July since tracking began in 2004. It is 9% below last year’s lethargic level. The 3-year average before COVID (2017 to 2019) was 2,679 pending sales, 65% more than today, or an additional 1,022. If more homes were available, the demand readings would rise because now there are more buyers than homes available. Yet, it would not climb to pre-pandemic levels because of today’s dire affordability predicament.
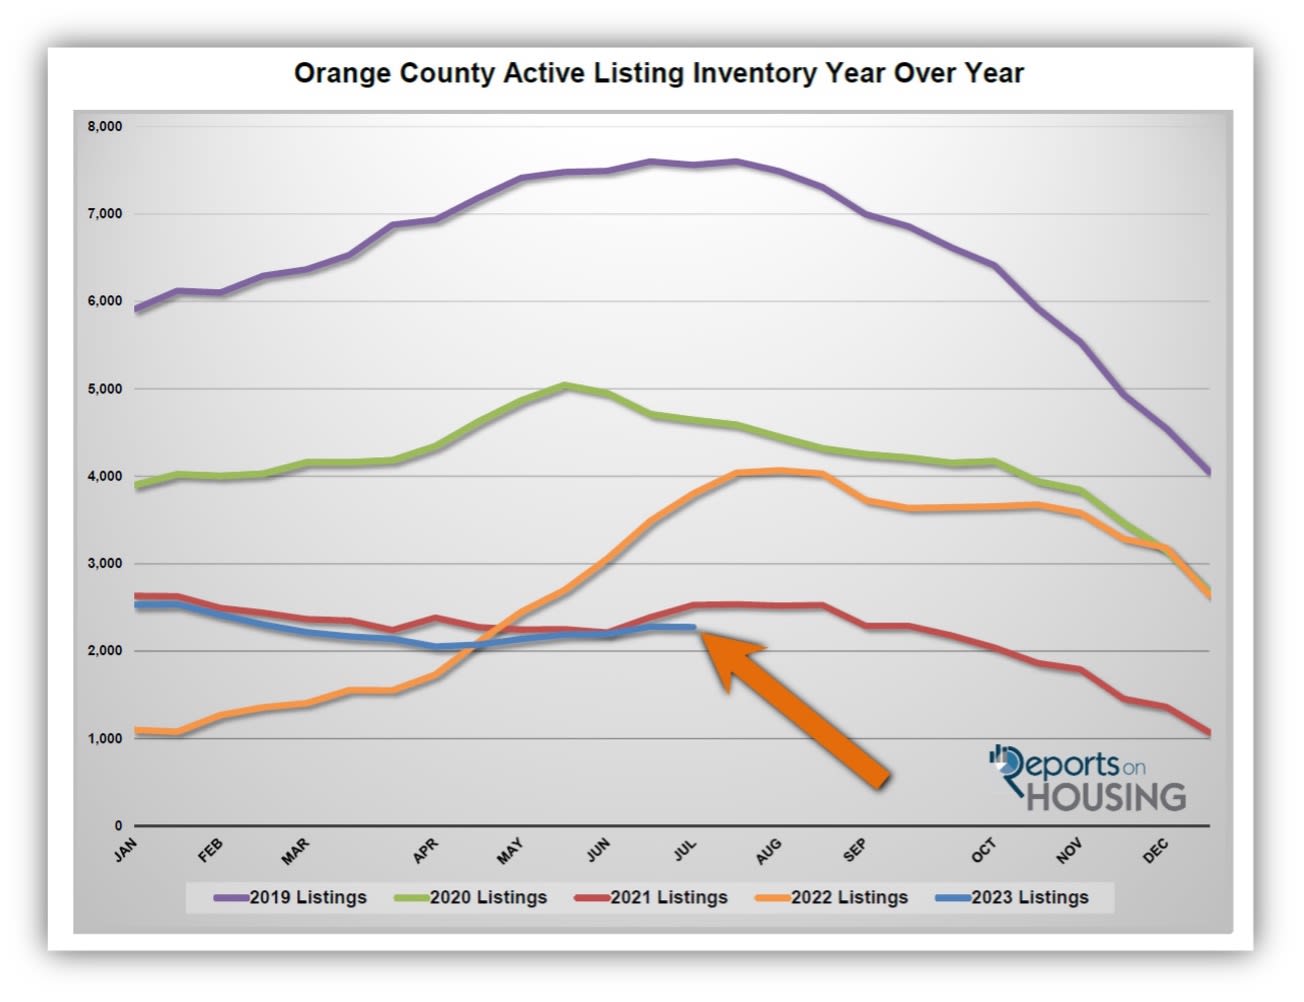
Today’s market feels incredibly hot because low demand is pitted against even lower inventory. Demand may be 39% lower than the average before COVID, but the inventory is an astonishing 66% lower. There are only 2,276 homes available in all of Orange County, versus 3,806 last year when there were 67% more options. The 3-year pre-pandemic average is a mind-blowing 6,708, nearly triple today. There are not enough homes available to adequately satiate today’s weaker demand.
The main reason the inventory has ground to a halt and has not changed much this year is that far fewer homeowners are willing to sell their homes. They are unwilling to move due to their current underlying, locked-in, low fixed-rate mortgage. The difference between their underlying rate and today’s prevailing rate is significant and precludes many homeowners from listing their homes for sale and moving to another house. An eye-opening 87% of all California homeowners with a mortgage enjoy a fixed rate at or below 5%. 69% have a rate at or lower than 4%. Through June, there have been 12,267 new sellers in Orange County, 9,872 fewer than the 3-year average before COVID (2017 to 2019), 45% less.
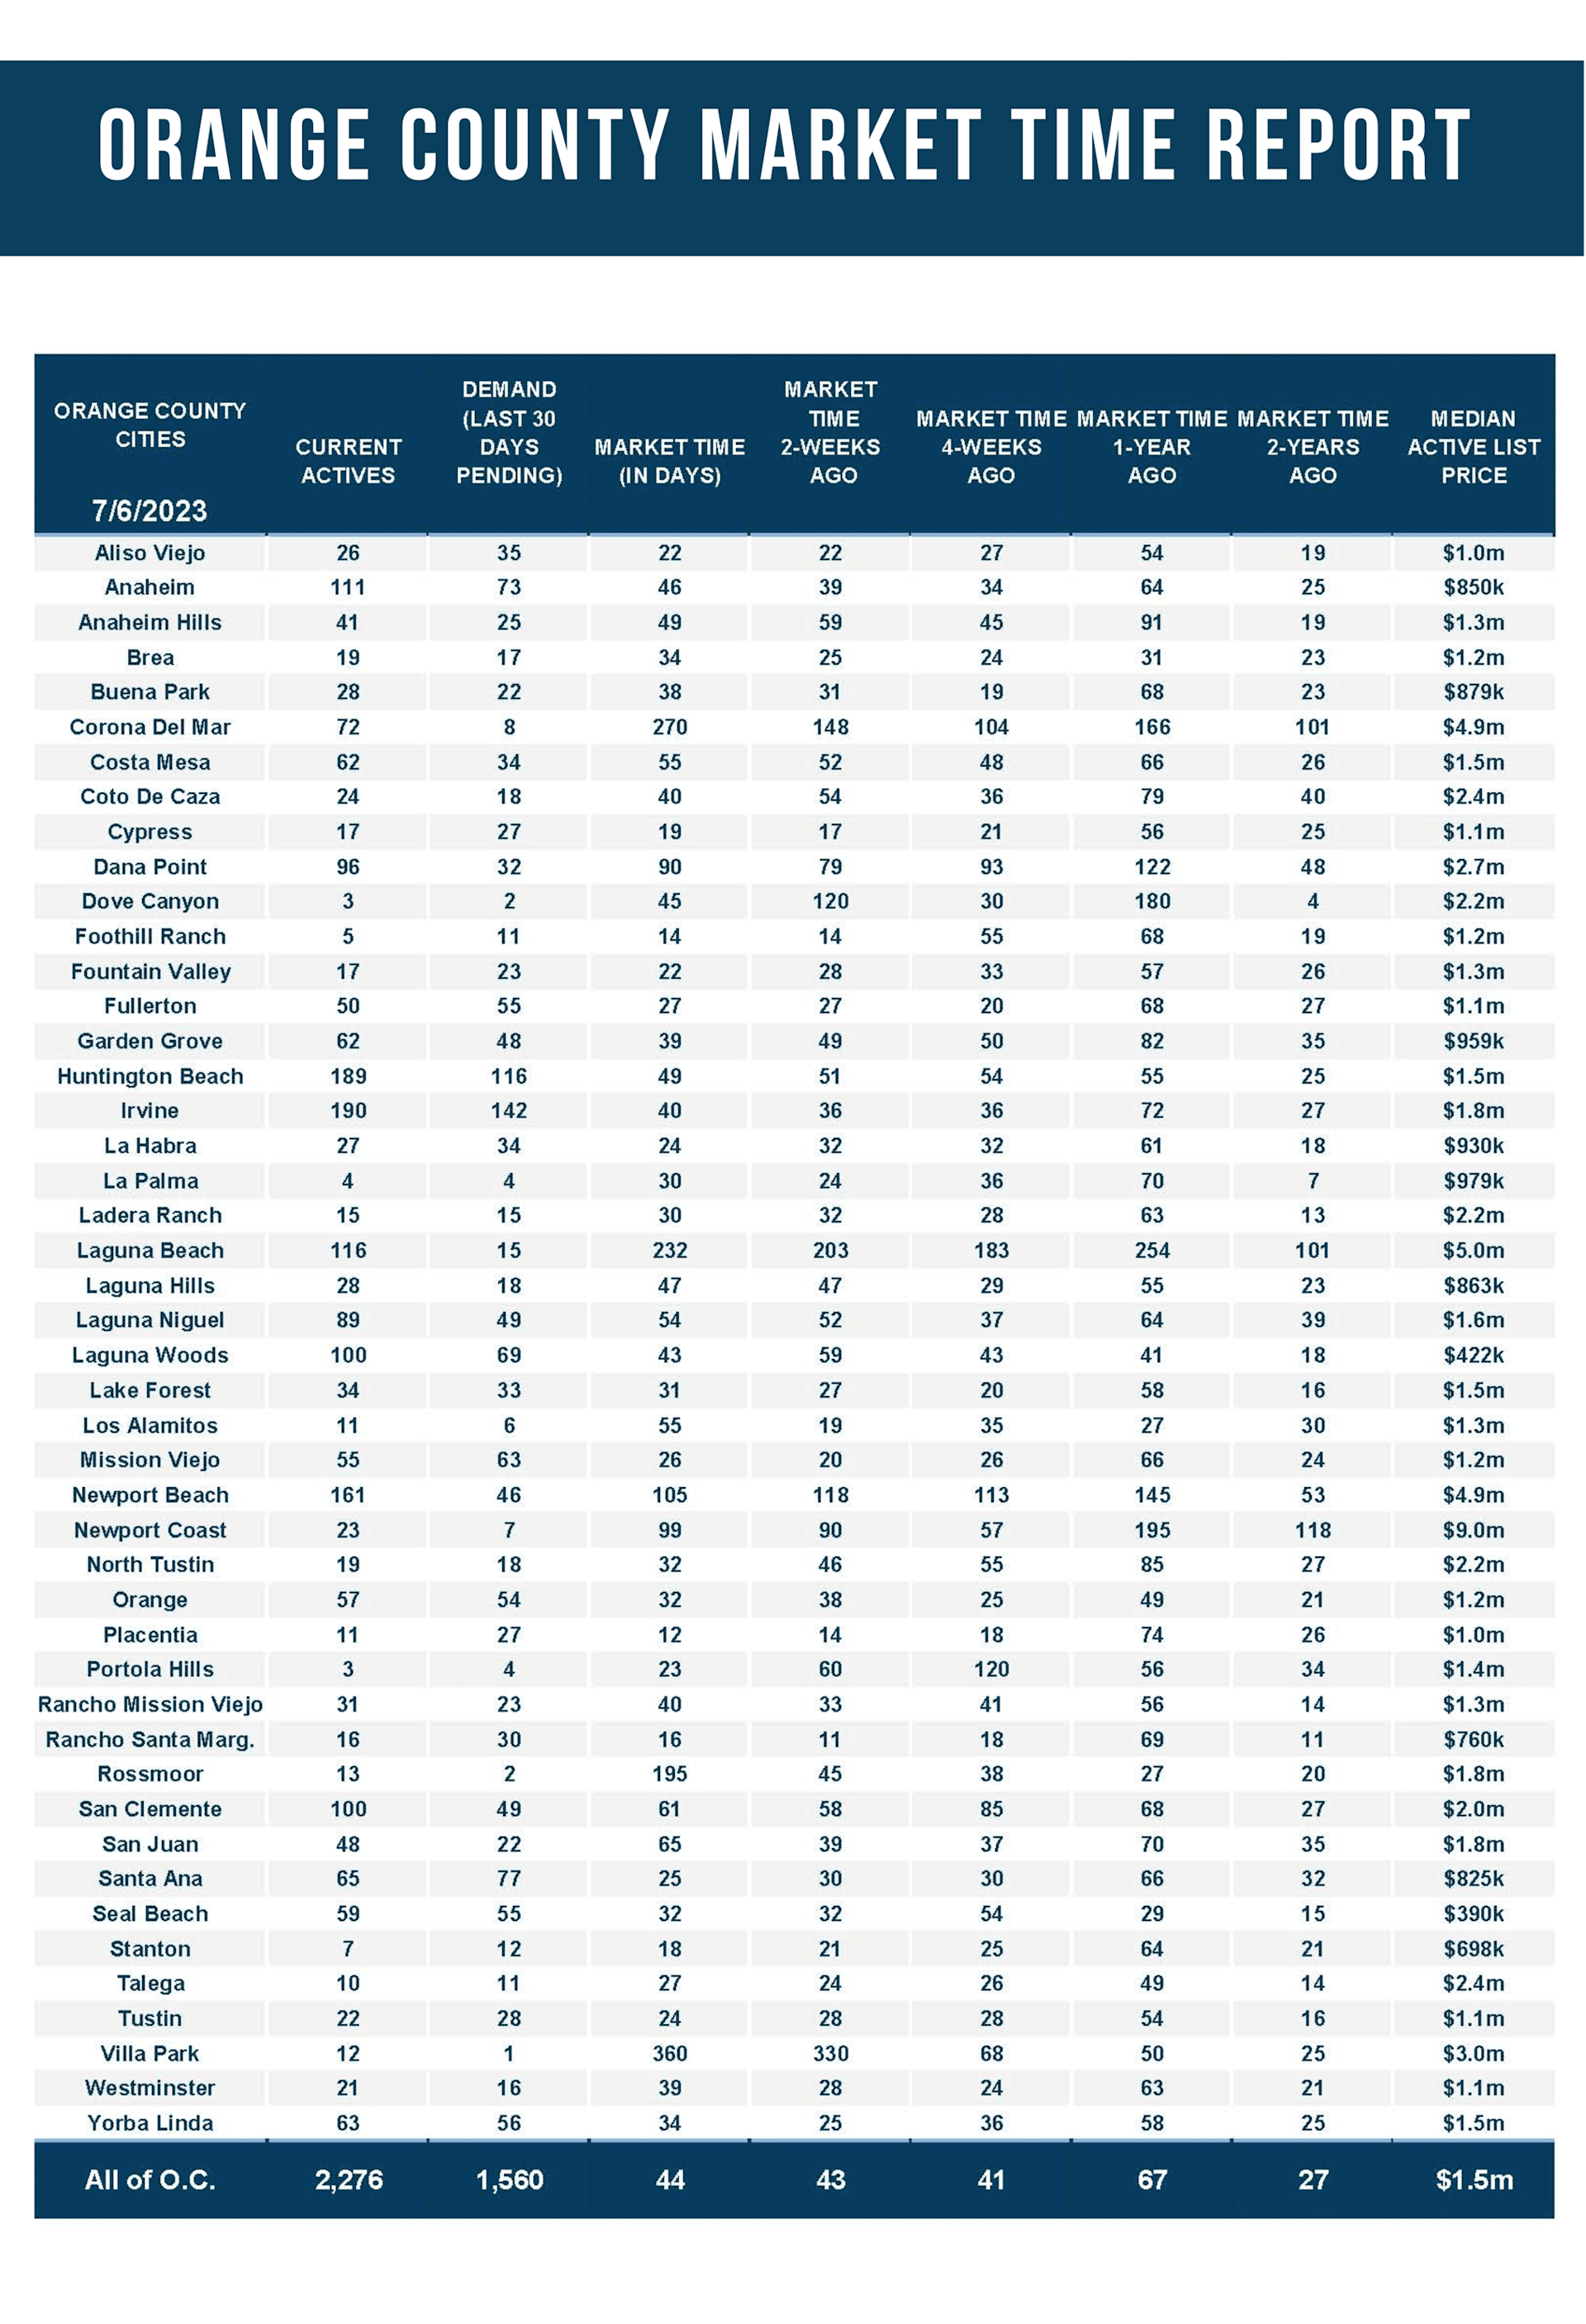
Even with today’s home affordability predicament, the market is scorching with an Expected Market Time (the number of days to sell all listings at the current buying pace) at 44 days, the second lowest level for a start to July since tracking began in 2004, only behind 2021. It is not because of unbelievable buyer demand. Instead, look to the drought of FOR-SALE signs.
The active inventory declined by only five homes in the past couple of weeks.
The active listing inventory decreased by five homes in the past two weeks, nearly unchanged, and now sits at 2,276 homes, its lowest level for a start to July since tracking began in 2004. The inventory paused its extremely slow rise since mid-April because of the 4th of July holiday. The nation stops, and fewer homeowners cyclically place their homes on the market during the holiday week. The slow climb should continue this week, but expect the inventory to peak anywhere from the end of this month to the middle of August. There is only a little time for the inventory to grow. After reaching a peak, the inventory will slowly decline through the Autumn Market and pick up speed during the holidays, from mid-November through the New Year.
Last year, the inventory was 3,803, 67% higher, or 1,527 more. The 3-year average before COVID (2017 through 2019) is 6,708, an additional 4,432 homes, or 195% extra, nearly triple where it stands today.
Homeowners continue to “hunker down” in their homes, unwilling to move due to their current underlying, locked-in, low fixed-rate mortgage. This will continue until mortgage rates drop. For June, 2,280 new sellers entered the market in Orange County, 1,580 fewer than the 3-year average before COVID (2017 to 2019), 41% less. These missing signs counter any potential rise in the inventory.
Demand decreased by 35 pending sales within the past couple of weeks.
Demand, a snapshot of the number of new escrows over the prior month, decreased from 1,602 to 1,560 in the past couple of weeks, down 35 pending sales, or 3%. Last year demand plummeted by 151 pending sales or 8%. The year-over-year difference has diminished from 726 pending sales in March to 150 today, even though mortgage rates are 1.5% higher than a year ago. Mortgage rate volatility is far less than last year. The lack of volatility has allowed buyers to adapt to today’s higher-rate environment. Many are banking on rates to ease as the economy eventually cools, allowing them to refinance to a lower rate. Refinance demand will not only grow when rates fall but so will buyer demand.
Last year, demand was at 1,710, 10% more than today, or an extra 150. The 3-year average before COVID (2017 to 2019) was 2,582 pending sales, 67% more than today, or an additional 1,022.
With demand falling and supply unchanged, the Expected Market Time (the number of days to sell all Orange County listings at the current buying pace) increased slightly from 43 to 44 days in the past couple of weeks. Last year the Expected Market Time was 67 days, slower than today. The 3-year average before COVID was 78 days, much slower than today.
The luxury market did not change much in the past couple of weeks.
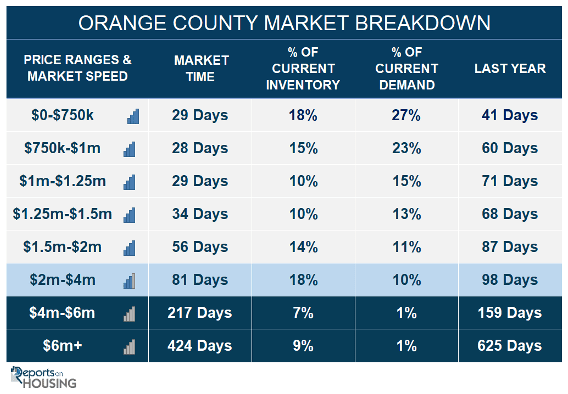
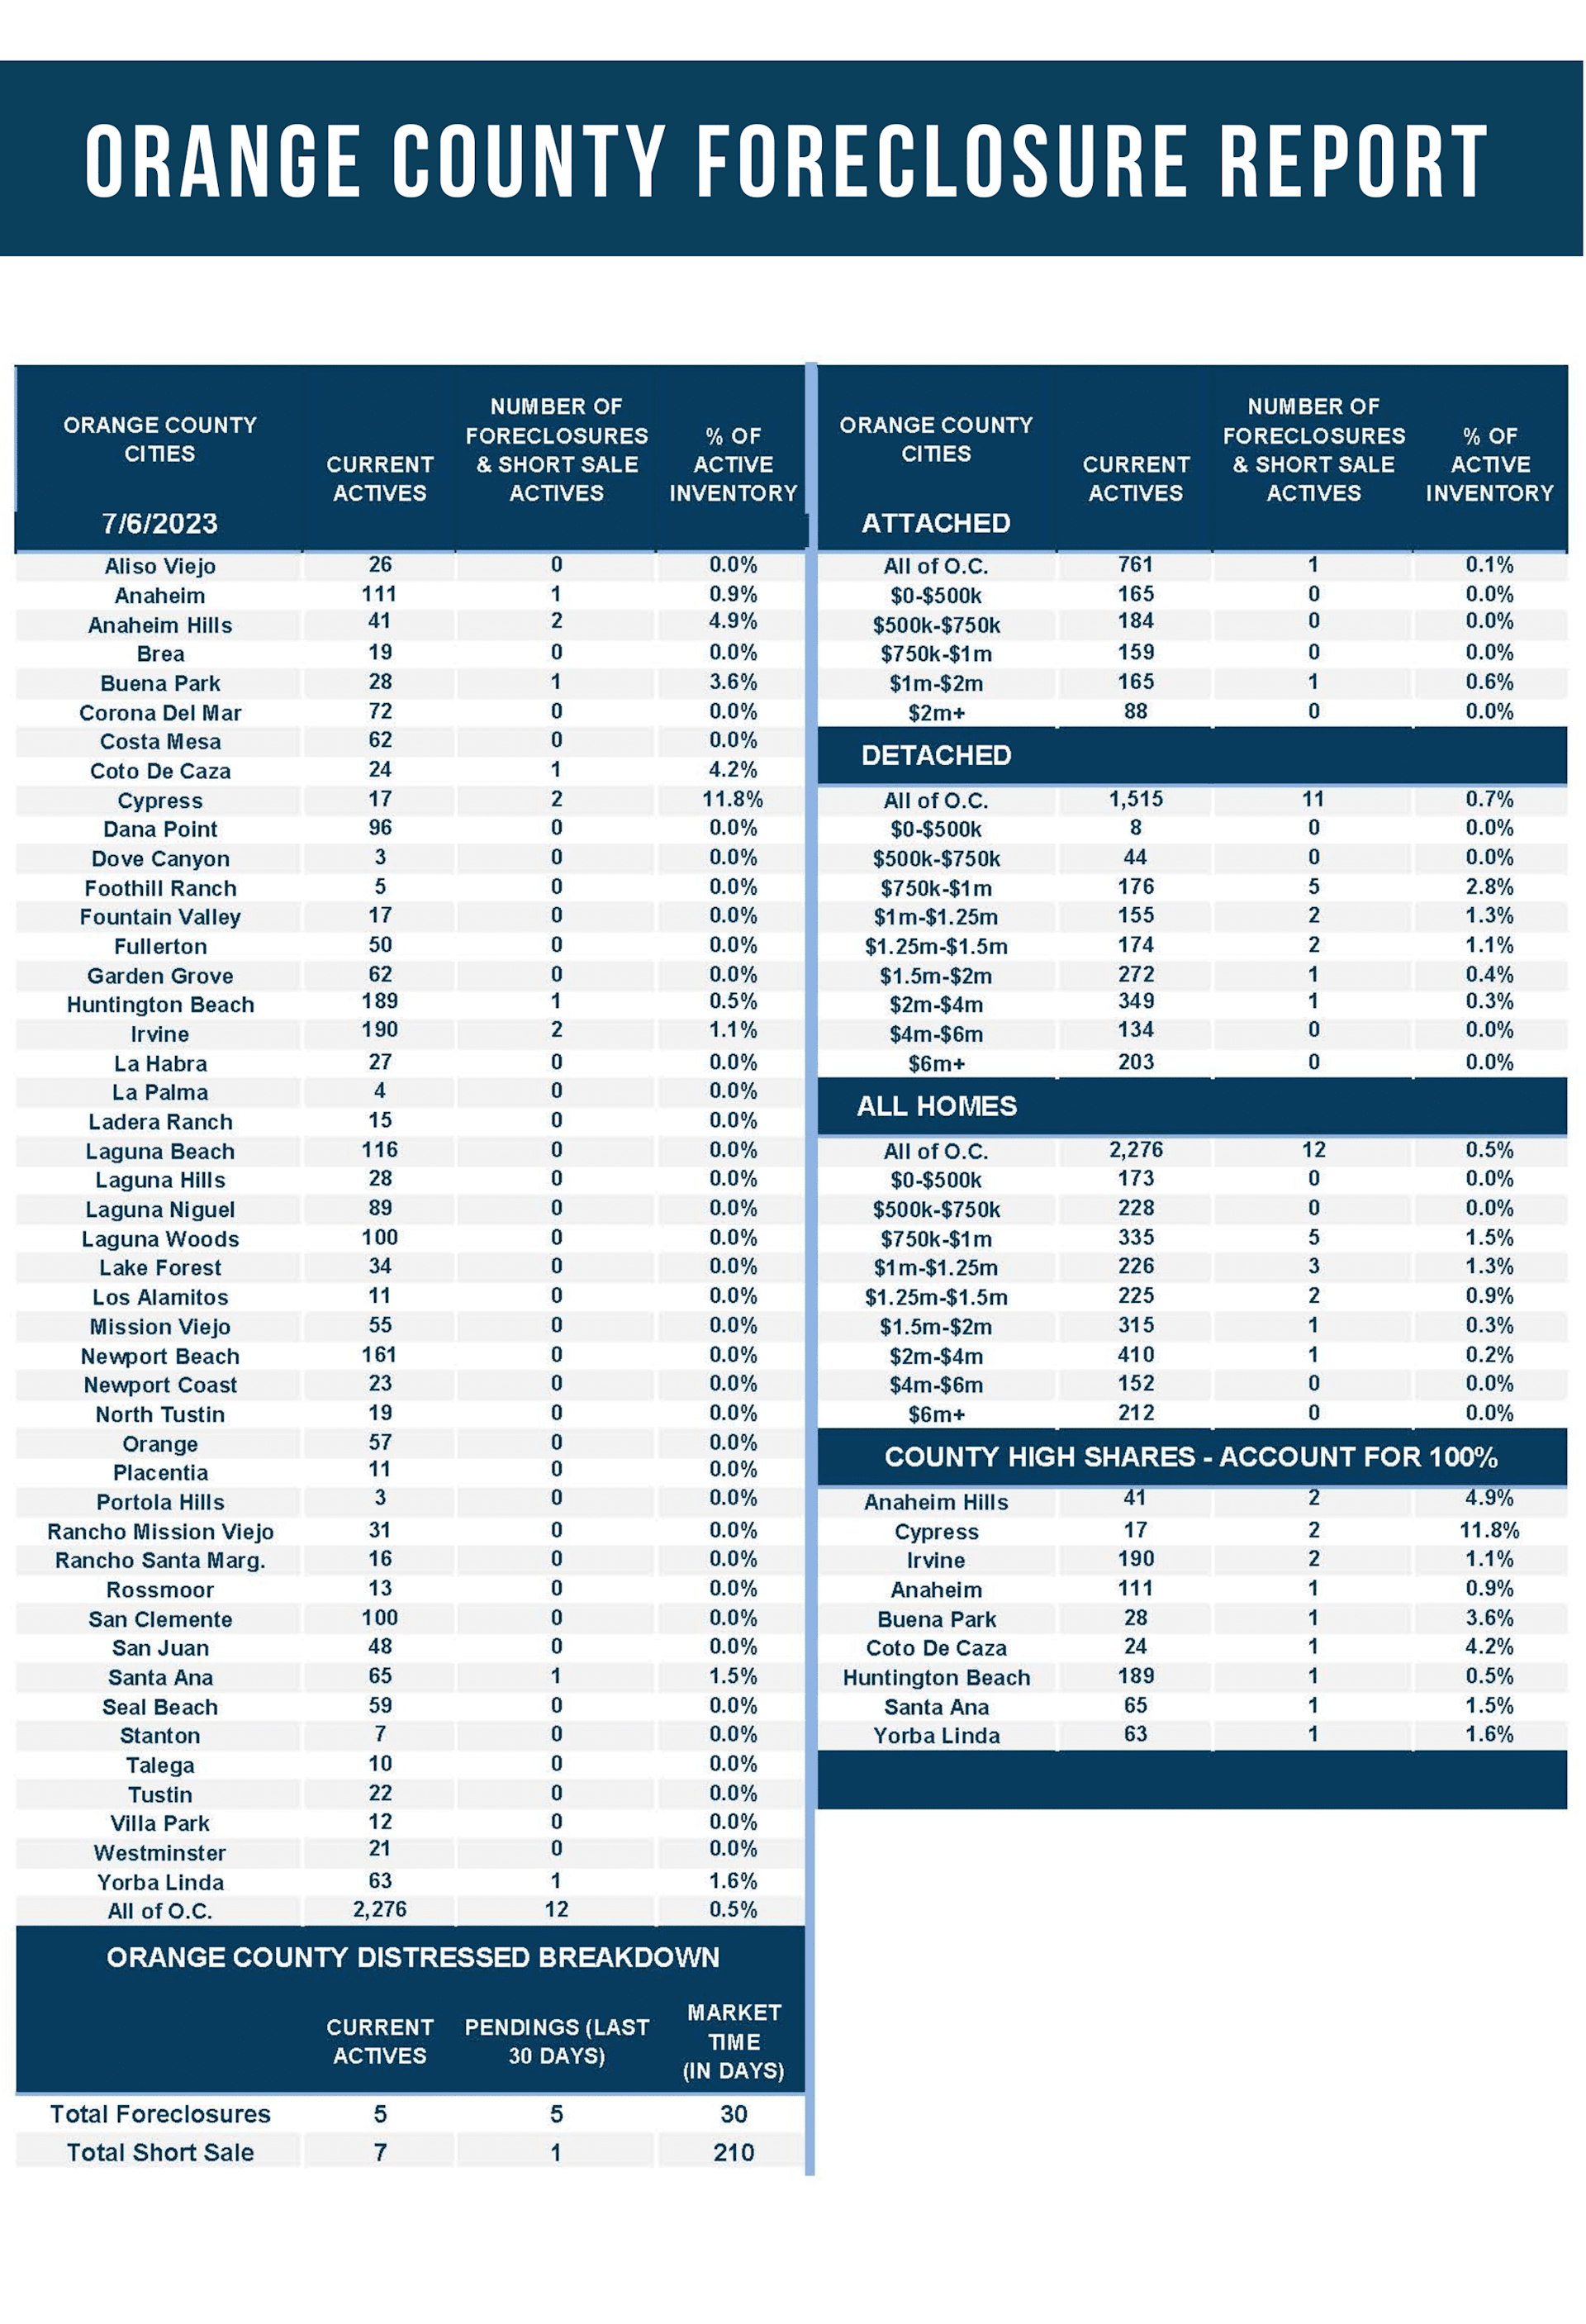
In the past couple of weeks, the luxury inventory of homes priced above $2 million increased from 769 to 774 homes, five additional homes, up 1%. It is the highest level since November. Luxury demand decreased by two pending sales, down 1%, and now sits at 187, its lowest level since March. With a slight rise in supply and a small drop in demand, the Expected Market Time for luxury homes priced above $2 million increased from 122 to 124 days, its highest level since the start of February. Luxury is vastly different from the lower ranges. Carefully pricing luxury homes is crucial in securing success.
Year over year, luxury demand is down by nine pending sales or 5%, and the active luxury listing inventory is down by 49 homes or 6%. Last year’s Expected Market Time was 126 days, nearly identical to today. The year-over-year difference has evaporated. Luxury today feels a lot like the luxury market in July 2022.
For homes priced between $2 million and $4 million, the Expected Market Time in the past two weeks decreased from 89 to 81 days. For homes priced between $4 million and $6 million, the Expected Market Time increased from 131 to 217 days. For homes priced above $6 million, the Expected Market Time decreased from 435 to 424 days. At 424 days, a seller would be looking at placing their home into escrow around September 2024.