Many YouTube channels, TikTok, and Instagram accounts are devoted to the housing crash narrative. Either housing is crashing, or it is about to. They are convinced that the market will implode, and values will plunge similar to or worse than the Great Recession. The videos are persuasive in tone but lack the complete picture, ignoring the actual underlying facts. Many of these prognosticators lack the economic credentials and have been calling for a housing collapse for years, steering hundreds of thousands of unsuspecting viewers in the wrong direction, preying on everyone who has been unable to purchase over the years and has been rooting for housing’s demise so that they can finally capture a piece of the American Dream.
Home values rocketed higher from May 2020, right after the initial COVID lockdown, through May 2022. Rates plunged, reaching 17 record lows from March 2020 through January 2021, and remained low through March of last year. As rates climbed, the housing market slowed. After starting 2022 at 3.25%, they eclipsed 5% in May, 6% in September, and 7% in October. In the second half of the year, the housing crash crowd grew louder and louder as affordability eroded and home values declined. Is a housing downturn around the corner? Will home values plunge? The answer is straightforward in looking at the facts, not anytime soon. Ignore all the hype and rely on data.
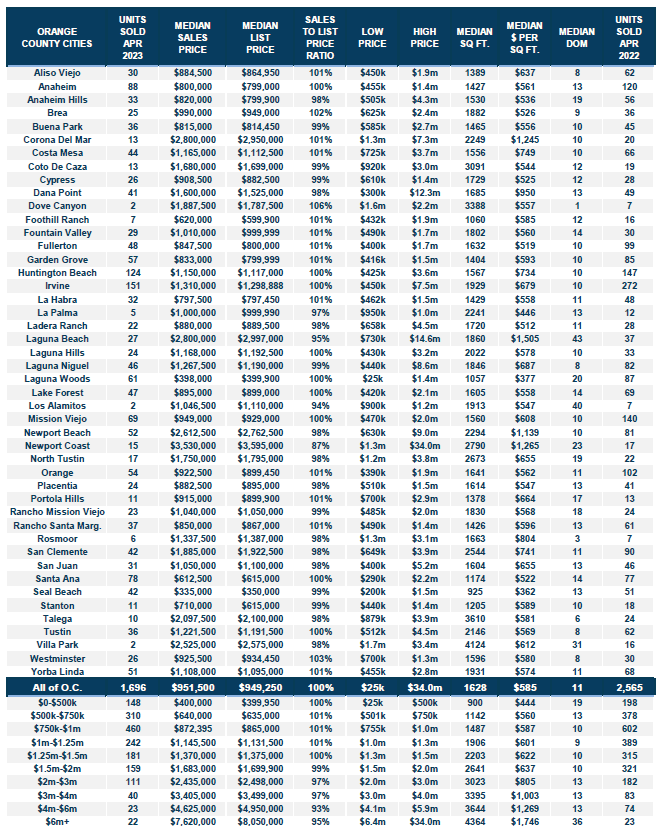
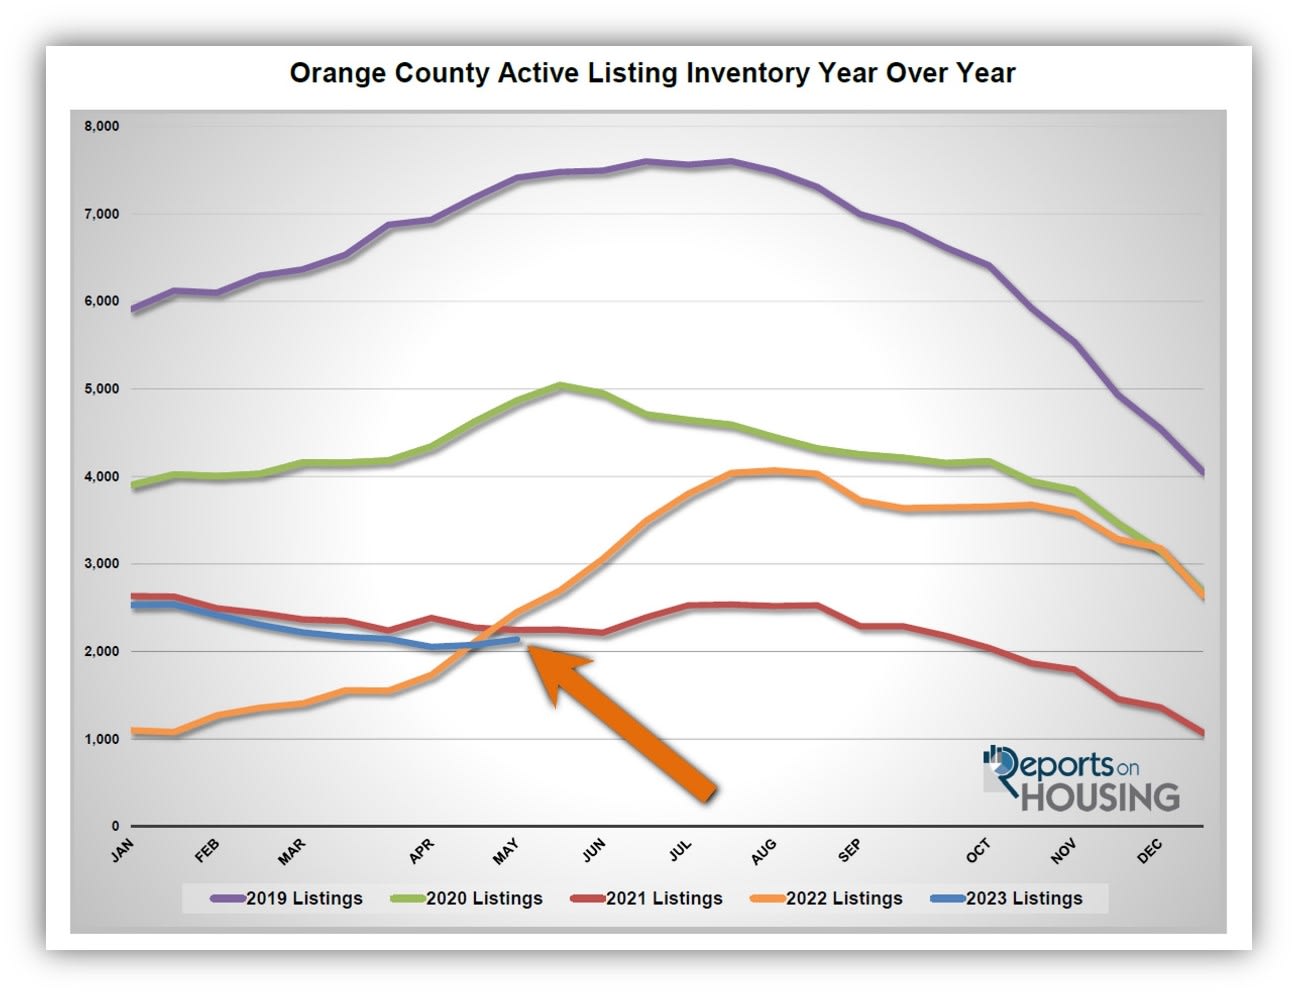
FACT – The active inventory in Orange County is at its lowest level in May since tracking began in 2004. Housing is experiencing a crisis, a catastrophically low level of available homes. During the Great Recession, a glut of homes was on the market. Today, the market suffers from the opposite condition: a minimal supply. For housing to tip in the buyer’s direction, the inventory needs to rise at the very least to pre-pandemic levels. The 5-year average peak from 2015 to 2019 was 7,058 homes. There are only 2,139 homes available today. Last year, the inventory grew substantially from April through August, peaking at 4,069 homes. It stopped climbing due to a lack of sellers coming on the market. The inventory is not poised to rise anywhere near 7,000 homes anytime soon
FACT – Fewer homeowners are coming onto the market, exacerbating the inventory crisis. Typically there are a similar number of new sellers every month, year in, year out. During the initial COVID lockdown, there were fewer FOR-SALE signs in the first several months. That turned around as 2020 rolled along. This trend reoccurred last year as rates grew and has only intensified since August. In the final five months of 2022, there were 4,058 fewer sellers, 30% less than the 3-year average before the pandemic (2017 to 2019). In the first four months of this year, it has grown to 6,551 fewer sellers, 46% less. This trend will continue as long as mortgage rates remain elevated. Homeowners continue to “hunker down” in their homes, unwilling to move due to their current underlying, locked-in, low fixed-rate mortgage. The difference between their underlying rate and today’s prevailing rate is significant and precludes many homeowners from listing their homes for sale and moving to another house.
FACT – Mortgage rates have reached a height and will eventually drop as the economy cools, instigating higher demand. Mortgage rates eclipsed 7% in October and November of last year, stretching to 7.37%, according to Mortgage News Daily, in October, its highest level since 2002. In March of this year, rates eclipsed 7% for a couple of days before dropping to the mid-6s with the collapse of Silicon Valley Bank and a couple of other banks. Since then, it has been bouncing between 6.25% and 6.75%. It is stuck in this range until the economy slows, unemployment rises, job openings fall, and consumer spending eases. It takes a while for all the Federal Reserve’s Federal Funds Rate increases to hit the economy fully. They have hiked the short-term rate from 0% to 5.5% in only 14 months, the swiftest rise since 1981. Ultimately, obtaining credit for businesses is substantially more costly today, eventually impacting the economy. Investors prefer long-term investments, such as treasuries and mortgage-backed securities, as the economy cools. This will result in rates dropping between 5.75% to 6.25%. If the economy slips into a recession, the flight to long-term investments will intensify, and rates will settle between 5.25% to 5.75%. These lower rates will increase demand as buyers’ purchasing power and affordability improves.
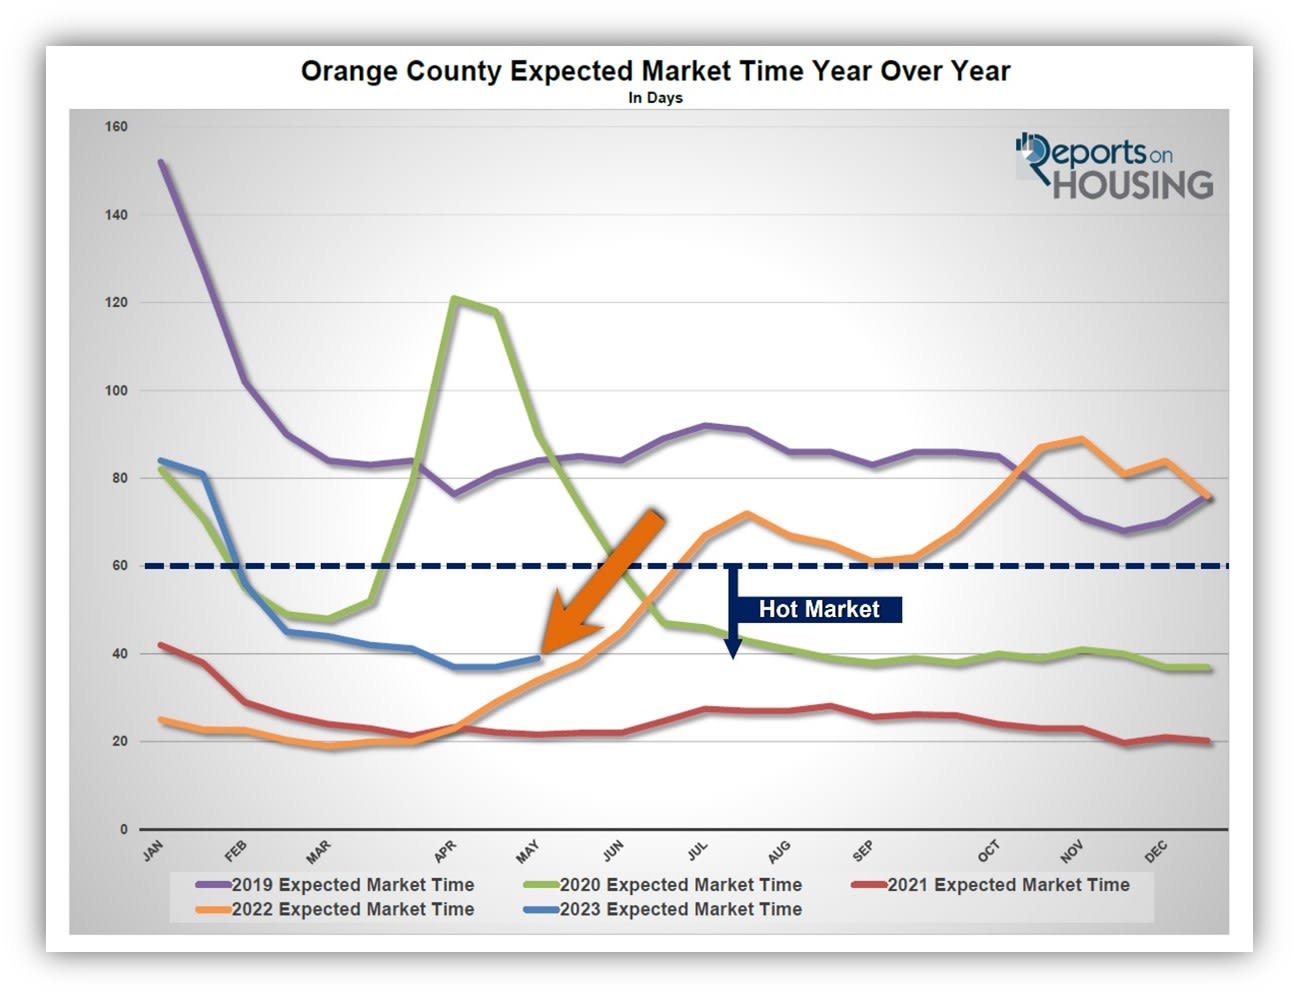
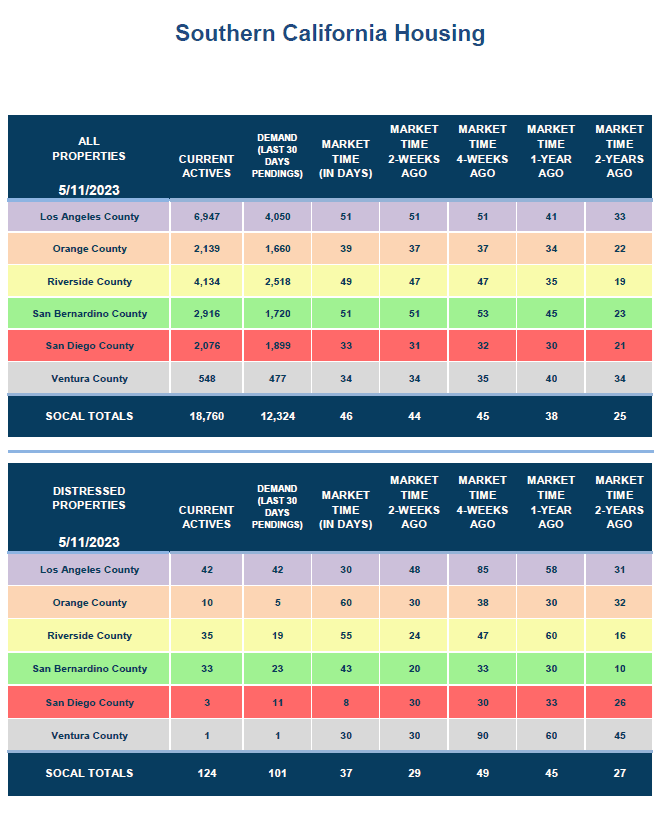
FACT – The housing market is scorching, with the market time dropping to 39 days, its lowest level since May last year. The Expected Market Time, the amount of time between hammering in the FOR-SALE sign to pending sales status, has dropped from 84 days at the start of the year to 39 days today. Anything below 60 days is considered hot. The lower the level, the hotter the market. At 39 days, when homes are priced according to their Fair Market Value, they are greeted with plenty of activity, tons of showings, multiple offers, sell quickly, and, in many cases, sell for more than their asking prices. The Expected Market Time is a function of supply, the available number of homes, and demand, a snapshot of recent pending sales activity. Demand readings have been muted because of higher mortgage rates and a lack of sellers; you cannot purchase what is not for sale. There are currently plenty of frustrated buyers who are not able to buy after writing offers on multiple homes with no success. When a home generates ten offers, only one buyer “wins.” The exceptionally low inventory has contributed mightily to the low market time levels. The 3-year average before COVID (2017 to 2019) was 68 days, significantly slower than today’s level, yet it was still a market that favored sellers.
The bottom line: facts and data do not lie. Buyer, seller, and all consumer expectations should be grounded in facts, not the hype of social media channels continuously pushing false narratives. Today’s housing market is hot and will not change much anytime soon. There is no crash in sight.
Active Listings
The active inventory increased by 3% in the past couple of weeks.
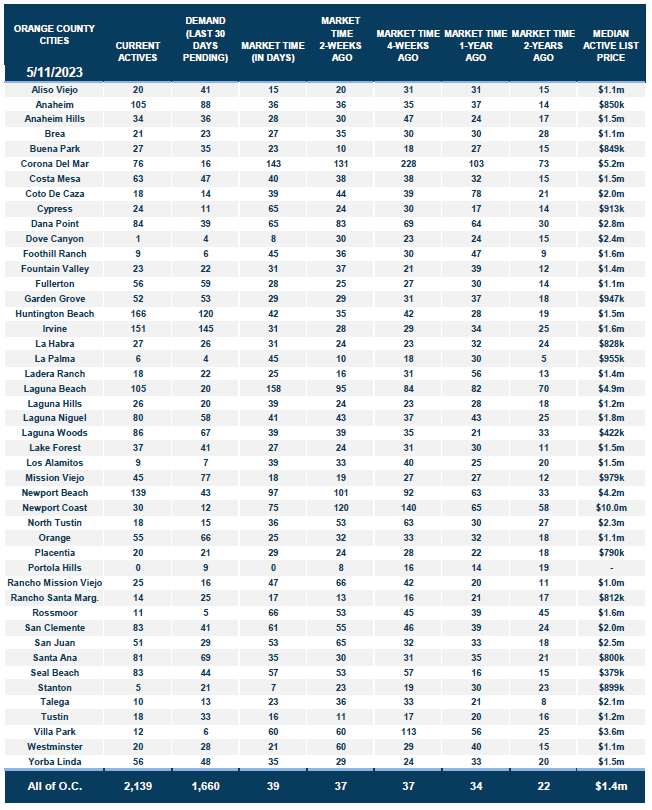
The active listing inventory increased by 63 homes in the past two weeks, up 3%, and now sits at 2,139 homes, its largest rise of the year. The 3-year average rise before COVID (2017 to 2019) was 259 homes. Last year, it surged higher by 17%, adding 348. The 63-home rise is doing very little to address the inventory crisis that is starved for more available homes. From here, we can expect the inventory to rise slowly until peaking between July and mid-August. That leaves little time to build an inventory. The lack of available homes is a profoundly entrenched trend that will not improve much anytime soon.
Last year, the inventory was 2,139, 15% higher, or 313 more. The 3-year average before COVID (2017 through 2019) is 6,255, an additional 4,116 homes, or 192% extra, nearly triple where it stands today.
Homeowners continue to “hunker down” in their homes, unwilling to move due to their current underlying, locked-in, low fixed-rate mortgage. For April, 2,037 new sellers entered the market in Orange County, 1,983 fewer than the 3-year average before COVID (2017 to 2019), 49% less. These missing signs counter any potential rise in the inventory.
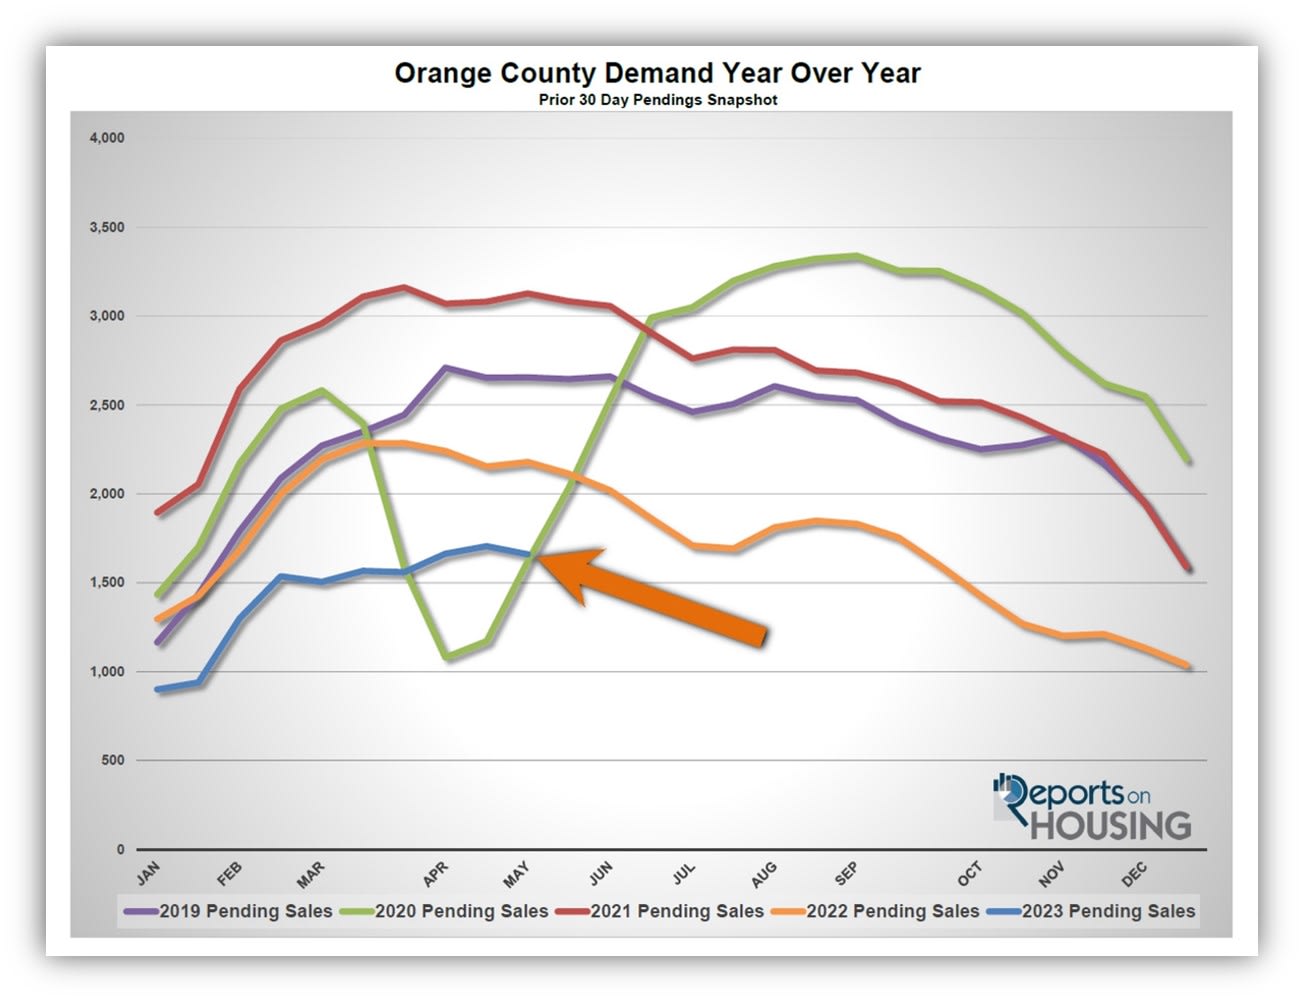
Demand, a snapshot of the number of new escrows over the prior month, decreased from 1,706 to 1,660 in the past couple of weeks, down 46 pending sales, or 3%. Today’s level is the lowest for mid-May since 2020, during the initial COVID lockdown, when it climbed to 1,622. It is crucial to understand that today’s demand readings are not only impacted by higher mortgage rates and unaffordability but also substantially affected by significantly fewer sellers coming on the market. Demand may be low, but the buyers in the house-hunting game are competing against each other. The market is very hot despite lower demand and fewer sales.
Last year, demand was at 2,179, 31% more than today, or an extra 519. The 3-year average before COVID (2017 to 2019) was 2,765 pending sales, 67% more than today, or an additional 1,105.
With supply rising and demand falling, the Expected Market Time (the number of days to sell all Orange County listings at the current buying pace) climbed from 37 to 39 days in the past couple of weeks. Last year the Expected Market Time was 34 days, slightly faster than today, yet it was cooling fast due to increasing rates. The 3-year average before COVID was 68 days, a slower pace than today.
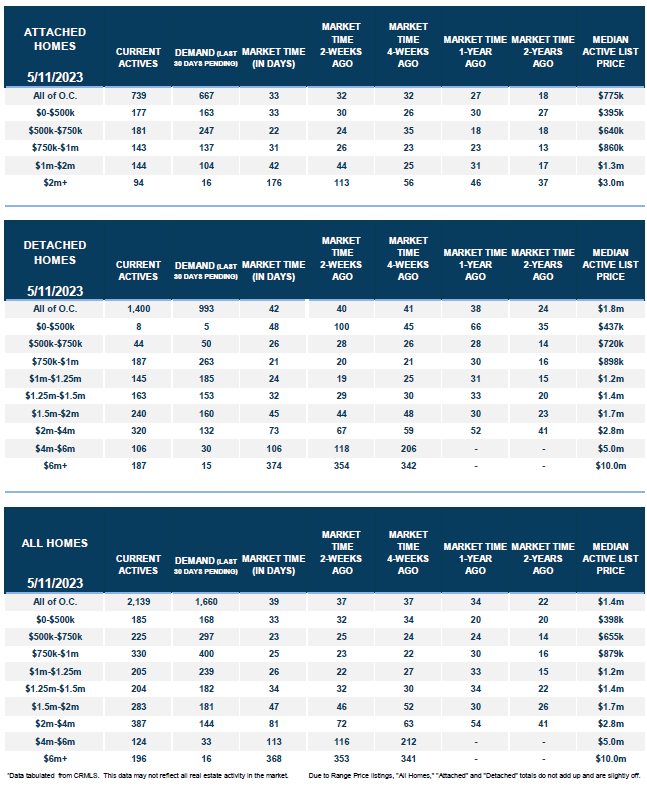
In the past couple of weeks, the luxury inventory of homes priced above $2 million increased from 677 to 707 homes, up 30 homes, or 4%, its highest level since November 2022. Luxury demand decreased by eight pending sales, down 4%, and now sits at 193. With the inventory rising and demand falling, the Expected Market Time for luxury homes priced above $2 million remained increased from 101 to 110 days, its highest level since March. Luxury is not selling as quickly as the lower ranges and necessitates a strategic approach and careful pricing. The higher the luxury price, the more intentional sellers need to be.
Year over year, luxury demand is down by 51 pending sales or 21%, and the active luxury listing inventory is up by 89 homes or 14%. Last year’s Expected Market Time was 76 days, which is better than today. The year-over-year difference is narrowing.
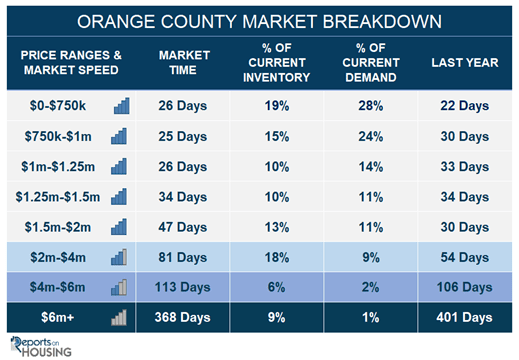
For homes priced between $2 million and $4 million, the Expected Market Time in the past two weeks increased from 72 to 81 days. For homes priced between $4 million and $6 million, the Expected Market Time decreased from 116 to 113 days. For homes priced above $6 million, the Expected Market Time increased from 353 to 368 days. At 368 days, a seller would be looking at placing their home into escrow around May 2024.
Orange County Housing Summary