October 16, 2023
As rates surge higher and affordability diminishes even more, smaller changes in market times shift the market in the buyer’s favor.
An Expected Market Time of 60 days is considered a Balanced Market today, yet that level used to be a Hot Seller’s Market prior to the run-up in mortgage rates that began in January 2022.
Gasoline prices can undoubtedly fluctuate quite a bit. This year in California, prices ballooned from $4.25 in January to $5.90 at the beginning of this month. From August to October, gas climbed by $1. These quick shifts in prices squeeze wallets and change the way consumers behave. Some will wait up to 25 minutes at Costco to fill up and save. Others will eat out less or run fewer daily errands. As gas prices climb, people drive less, and demand for fuel drops.
Similarly, mortgage rates have been much more volatile and have jumped all over the place this year. According to Mortgage News Daily, rates bounced from 5.99% on February 2nd to 7.1% on March 2nd. They then dropped back to 6.18% on April 6th until they jumped to 7.14% on May 26th. Recently, rates surged from 7.08% on September 1st to 7.8% today. This rapid evolution in rates can quickly disrupt the housing scene. Buyers behave differently as budgets are squeezed and are less willing to stretch regardless of low inventory levels.
Supply and demand, the good old Econ 101 principle, illustrates that as prices increase, supply rises while demand declines. As prices drop, supply shrinks while demand grows. From supply and demand levels, it can be determined when the market favors sellers or buyers. A balanced market, equilibrium, does not favor a buyer or seller.
Before the mortgage rate run-up at the beginning of last year, negotiations favored sellers when the Expected Market Time (the number of days to sell all Orange County listings at the current buying pace) dropped below 90 days. It was a Slight Seller’s Market from 60 to 90 days and a Hot Seller’s Market below 60 days. The market was balanced, not favoring buyers or sellers between 90 to 120 days. The market lined up in favor of buyers when the Expected Market Time was above 120 days. It was a Slight Buyer’s Market between 120 to 150 days and a Deep Buyer’s Market over 150 days. For perspective, during the Great Recession, the Expected Market Time soared to over 400 days, and bottomed at 19 days in March of last year.
As rates ballooned from 3.25% in January 2022 to 7.37% in October 2022, an unprecedented, swift climb, the Expected Market Time rose from 19 days in March to 87 days in October. Before skyrocketing mortgage rates, 87 days would have been considered a Slight Seller’s Market. Yet, home values in Orange County were falling. They peaked in May 2022 and dropped from June until they bottomed in December, seven straight months of declines. Yet, with a minimal inventory, the Expected Market Time never reached what previously was considered a Buyer’s Market. Then why did values drop?
Home values dropped in the second half of 2022 due to the rapid deterioration in home affordability. Many buyers were quickly priced out of the house-hunting game. They could no longer afford to purchase. As a result, demand dropped to levels last seen during the Great Recession. Yet, back then, the low demand was matched up against a glut of available homes, more than five times 2022 supply levels, and the Expected Market Time soared to record heights, over 400 days. In 2022, supply and demand were not just a function of price; a new variable, sky-high rates impacted them.
Affordability takes into account home prices, interest rates, and median incomes. As rates swelled, affordability rapidly crumbled. It was such a jarring shock to the marketplace that the buyers that remained cautiously approached purchasing and were unwilling to stretch the asking price at all despite not having many choices of available homes. Due to the market dynamics, sellers were forced to pivot and felt compelled to accept offers that were a little less than comparable sales. Thus, home values dropped.
High rates squeezed the market and altered the criteria for how a buyer’s market or seller’s market is determined. With today’s rates approaching 8%, a Seller’s Market has evolved to an Expected Market Time below approximately 53 days. It is a slight Seller’s Market from 40 to 53 days and a Hot Seller’s Market below 40 days. The market is balanced between 53 to 67 days. It is a Slight Buyer’s Market between 67 to 80 days and a Deep Buyer’s Market over 80 days.
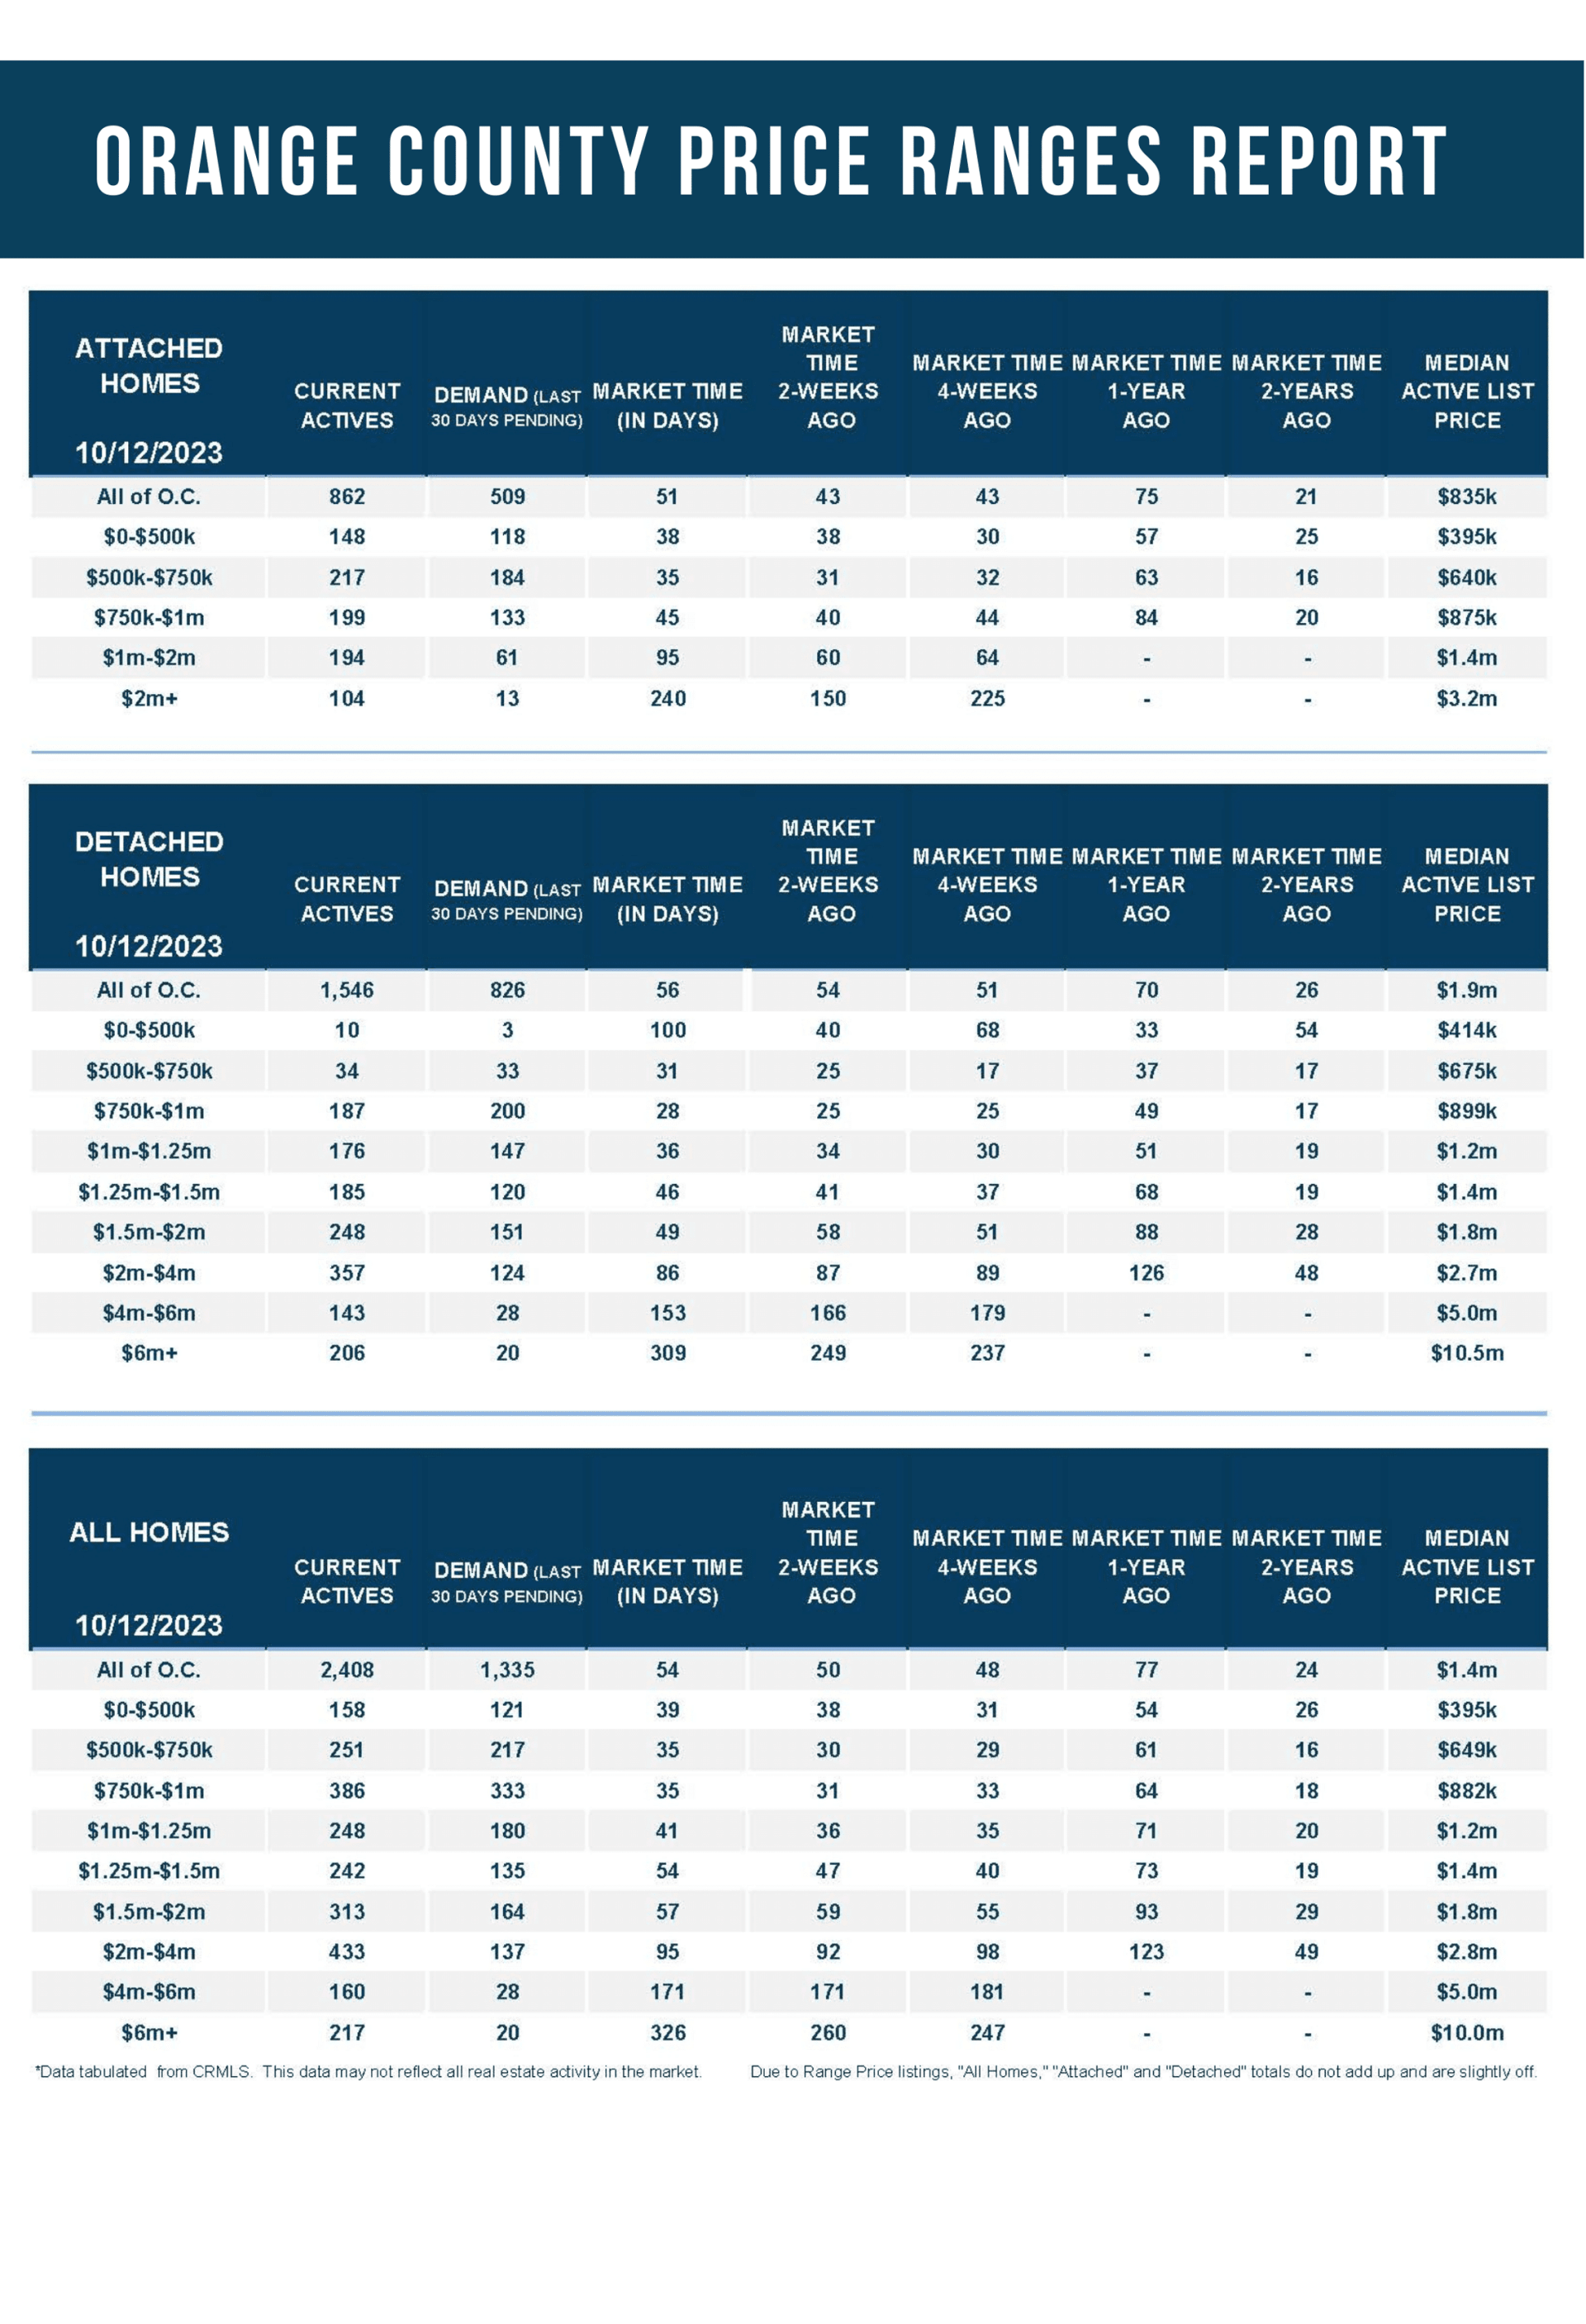
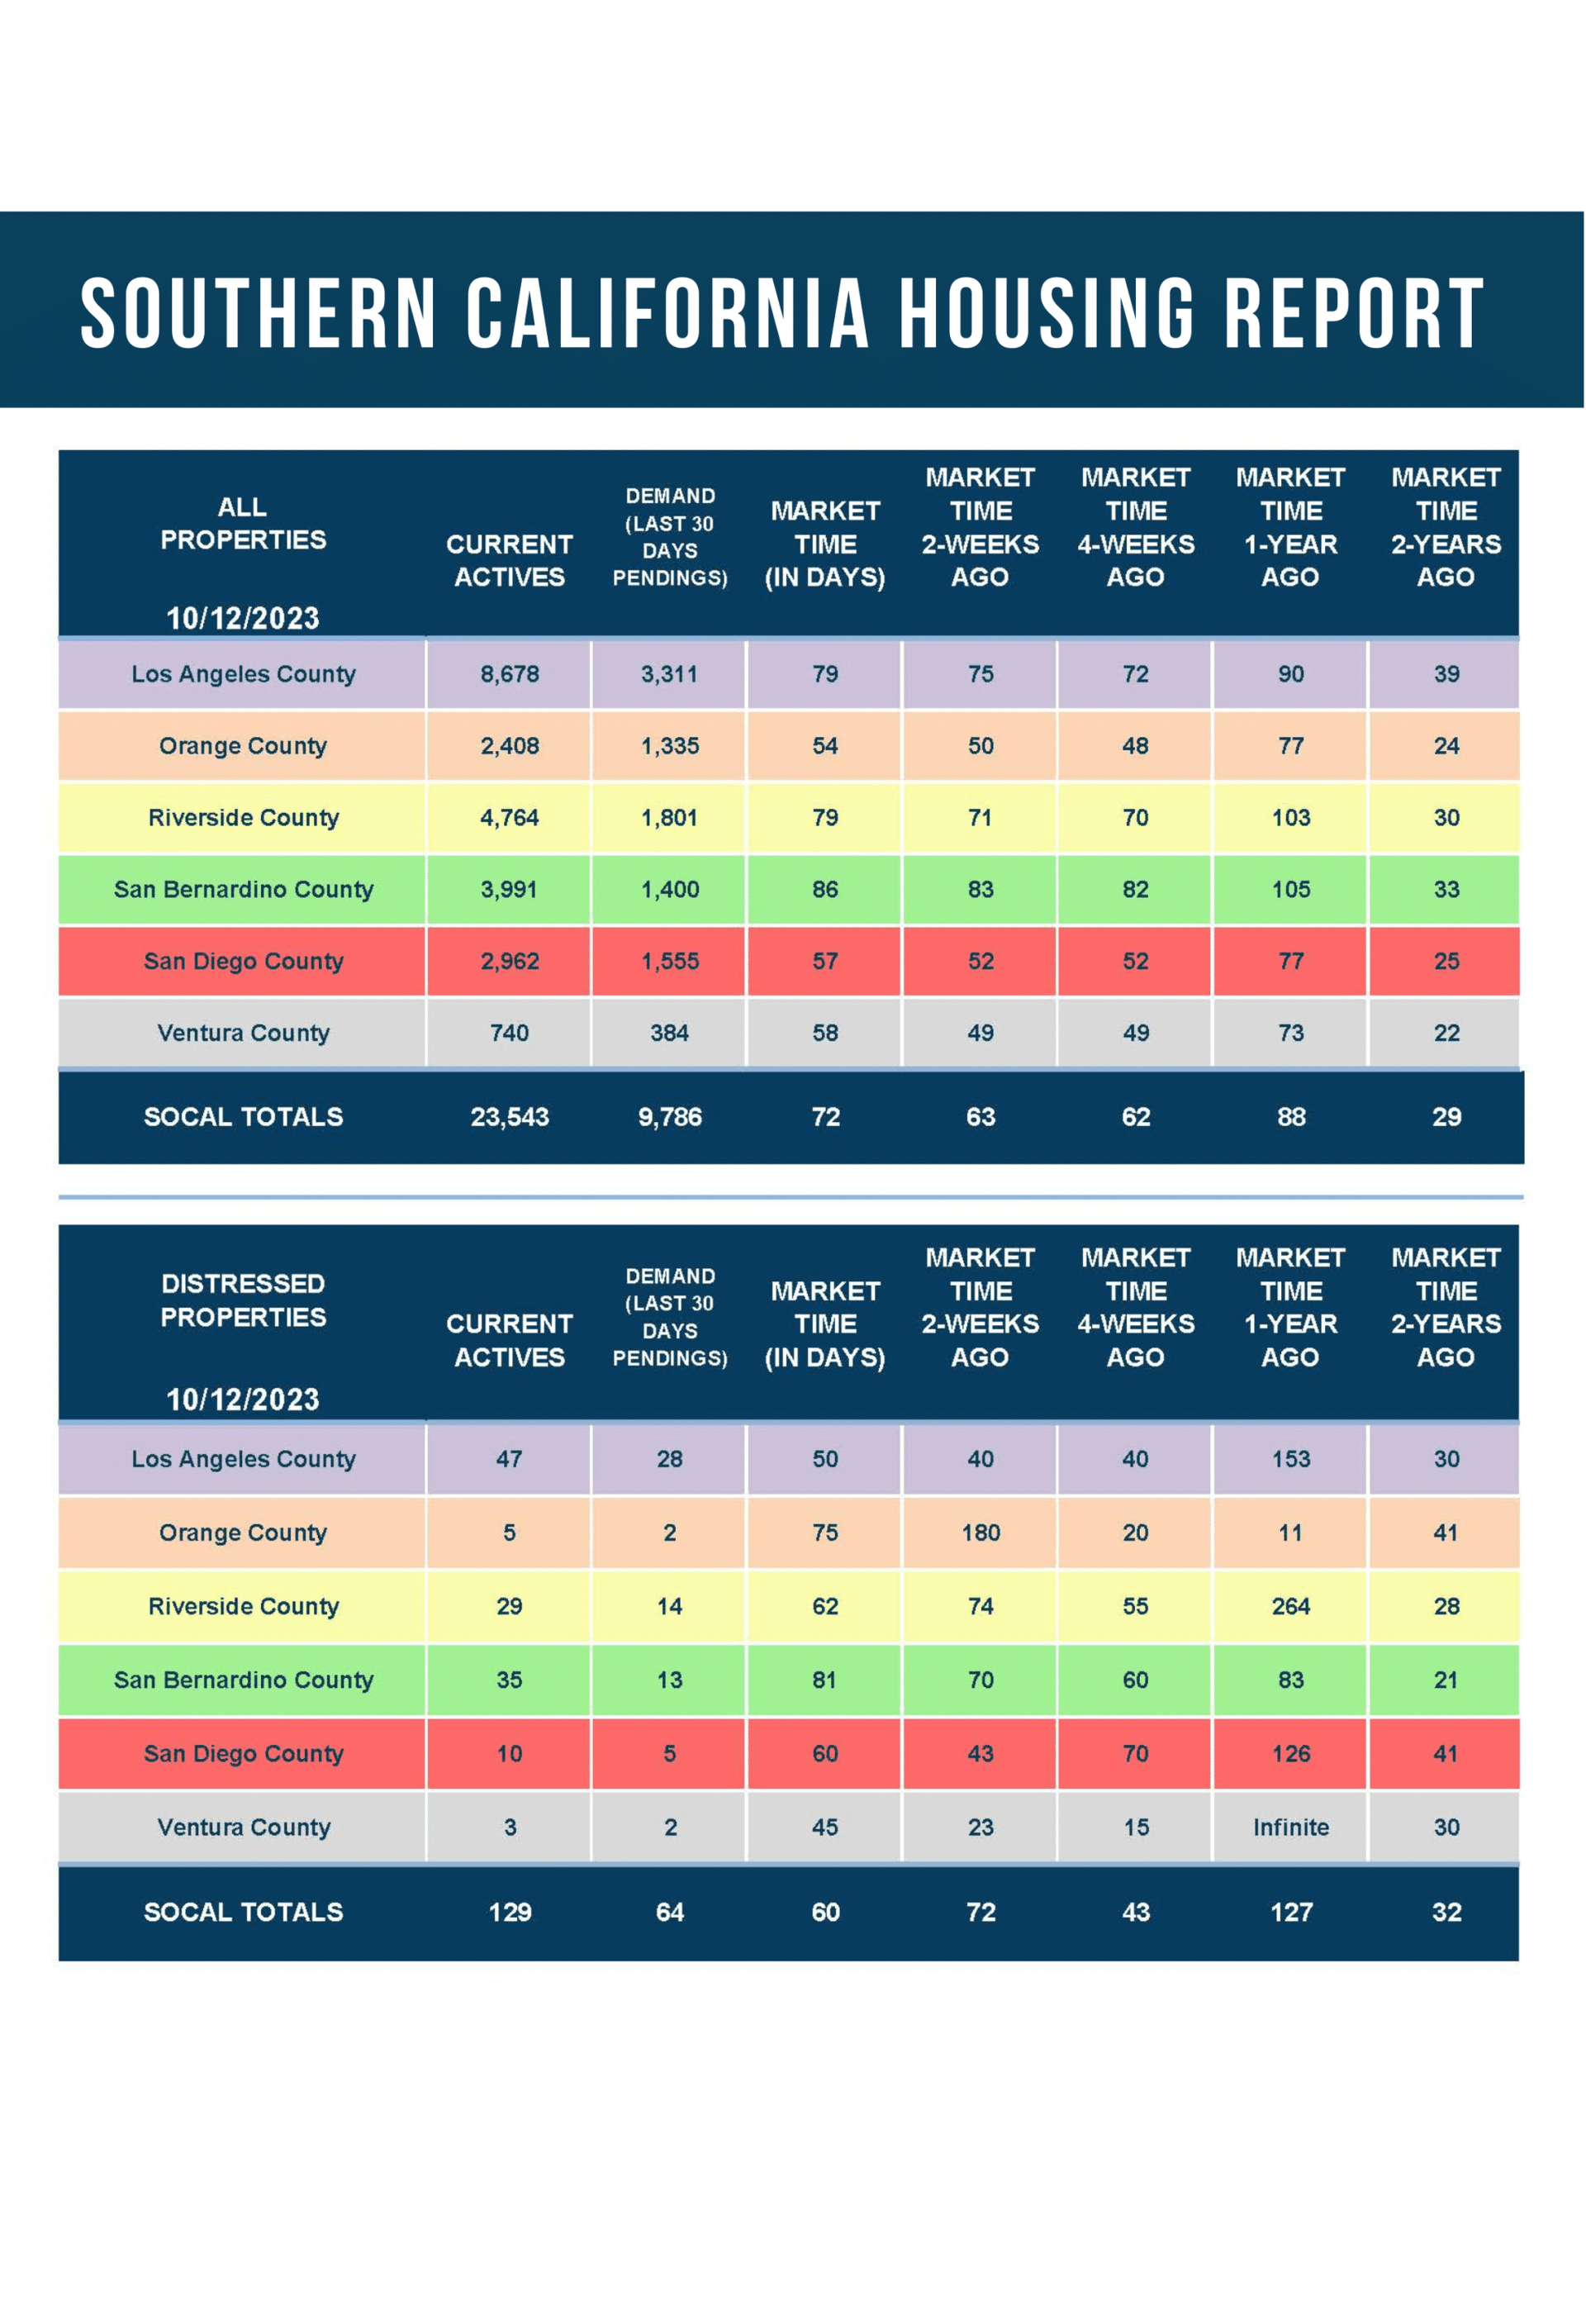
Today’s demand levels (snapshot of the number of new pending sales over the prior month) are less than last year, with 1,335 pending sales compared to 1,427, 6% less. Yet, they are matched against inventory levels significantly less than last year, with 2,408 available homes versus 3,656, 34% fewer. The Expected Market Time has been rising since hitting a low of 37 days at the end of April and is 54 days today. A 54-day Expected Market Time would have been considered a Hot Seller’s Market before the high mortgage rate environment, but not today. Today, it is balanced.
Mortgage rates have been stuck above 7% since the end of July as the financial markets now believe that the Federal Reserve will keep rates “higher for longer.” Since the Federal Reserve met last month and confirmed that they will keep the short-term rate higher for longer than previously anticipated, rates have climbed from 7.33% to 7.8% today, levels last seen in November 2000.
The Orange County housing market is strikingly different now that rates have shifted towards 8%, squeezing home affordability further and, in many markets, starting to favor buyers. As long as the inventory rises and demand falls, the Expected Market Time will climb, and values will eventually slip.
The active inventory increased by 3% in the past couple of weeks.
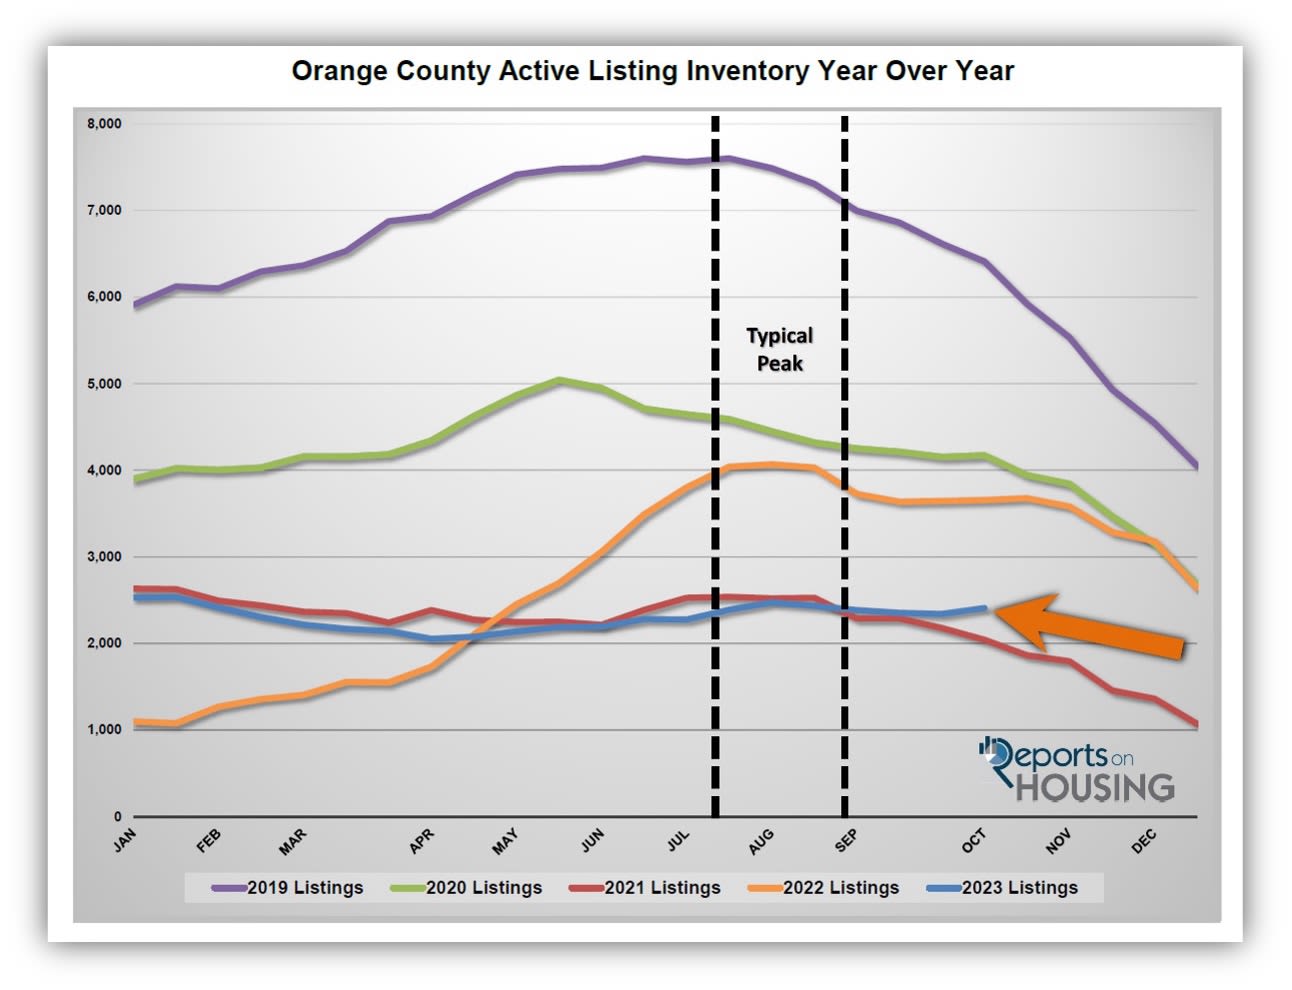
The active listing inventory increased by 68 homes in the past two weeks, up 3%, and now sits at 2,408 homes, its largest rise since the start of August. Typically, during the Autumn Market, the inventory is slowly falling. Yet, with mortgage rates knocking on the door of 8%, many new sellers coming on the market are finding that the market is no longer instantaneous, and homes are lingering with extended market times. Buyers are not consuming the inventory as rapidly, which continues to rise. The inventory is close to its 2,475 home peak reached in August. A new peak could be established if it continues growing at a similar pace over the next few weeks. Expect the inventory to continue its slow rise through the first couple of weeks of November. From there, the inventory will plunge until January 1st, the Holiday Market.
Last year, the inventory was 3,656 homes, 52% higher, or 1,248 more. The 3-year average before COVID (2017 through 2019) is 6,306, an additional 3,898 homes, or 162% extra, nearly triple where it stands today.
Homeowners continue to “kick back” in their homes, unwilling to move due to their current underlying, locked-in, low fixed-rate mortgage. For September, 1,915 new sellers entered the market in Orange County, 1,114 fewer than the 3-year average before COVID (2017 to 2019), 37% less.
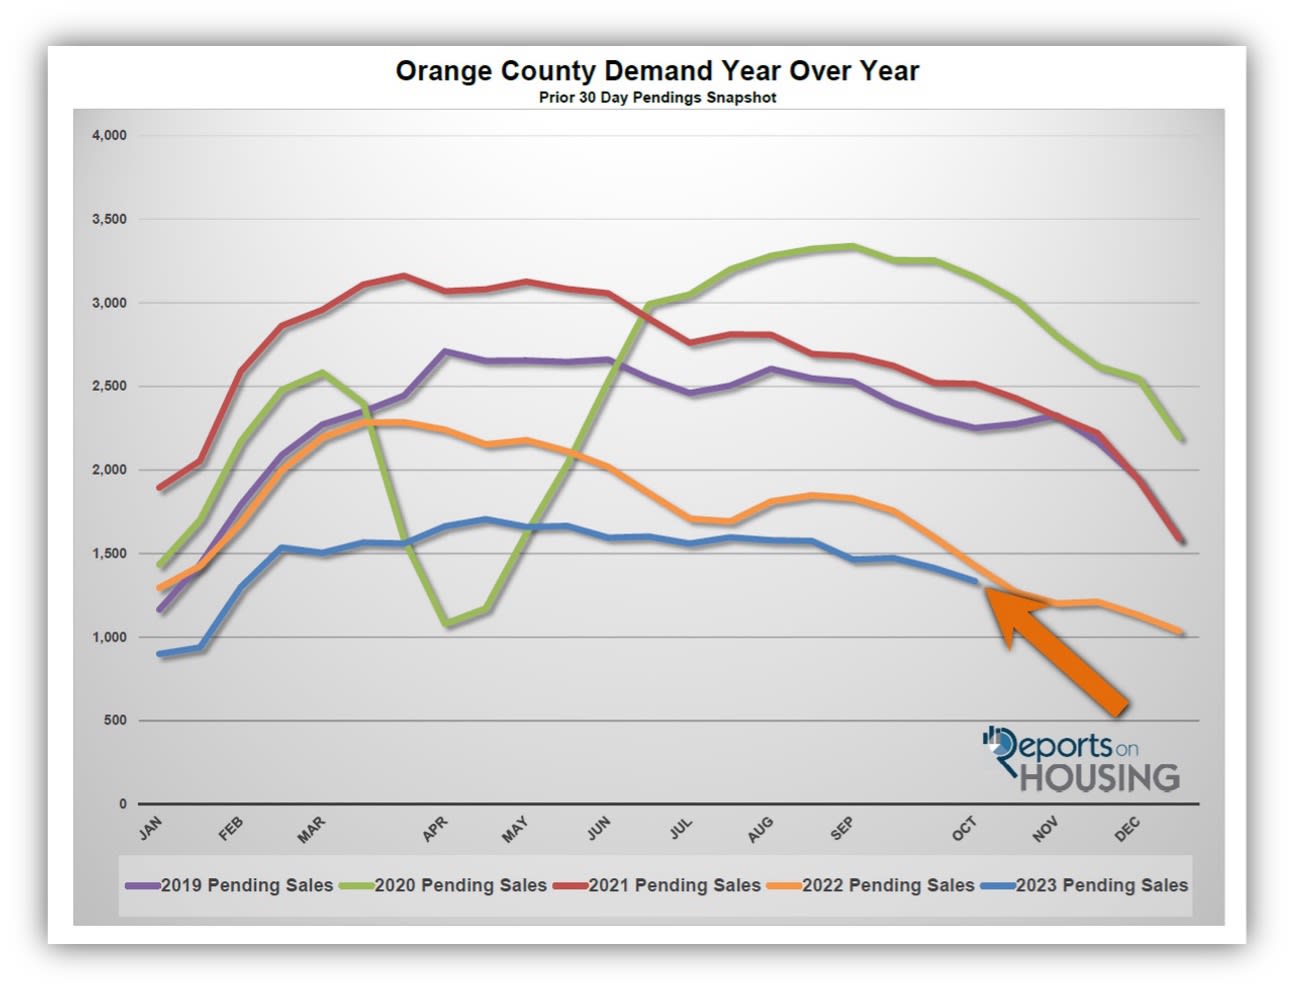
Demand dropped by 6% in the past couple of weeks.
Demand, a snapshot of the number of new pending sales over the prior month, decreased from 1,414 to 1,335 in the past couple of weeks, down 79 pending sales, or 6%, its lowest level since the start of February. It is the lowest October reading since 2007. Demand is at inherent levels. There will always be demand for homes. Everyone needs a roof over their heads, whether they rent or own. There are still plenty of cash buyers, buyers with cash in the bank who can make large down payments, and buyers with dual incomes high enough to absorb the higher costs of owning. Today’s levels are very close to last year, with only 92 pending sales fewer, or 6% less, yet rates were much lower at 7.12% compared to 7.8% today. From here, expect demand to continue to drop slowly, diminishing at a faster pace from mid-November through the start of next year, the Holiday Market.
Last year, demand was at 1,427, 7% more than today, or an extra 92. The 3-year average before COVID (2017 to 2019) was 2,206 pending sales, 65% more than today, or an additional 871.
With supply rising and demand falling, the Expected Market Time (the number of days to sell all Orange County listings at the current buying pace) increased from 50 to 54 days in the past couple of weeks, its highest level since the start of February. Last year, the Expected Market Time was 77 days, slower than today. The 3-year average before COVID was 87 days, significantly slower than today.
The luxury market cooled in the past couple of weeks.
In the past couple of weeks, the luxury inventory of homes priced above $2 million increased from 789 to 810 homes, up 21, or 3%, its highest level since July. Luxury demand decreased by six pending sales, down 3%, and now sits at 185. With inventory rising and demand falling, the Expected Market Time for luxury homes priced above $2 million increased from 124 to 131 days. Yet, at 131 days, the market is far from instant, and luxury sellers must carefully approach the housing market.
Year over year, luxury demand is up by 35 pending sales or 23%, and the active luxury listing inventory is up by 22 homes or 3%. Last year’s Expected Market Time was 158 days, slower than today.
For homes priced between $2 million and $4 million, the Expected Market Time in the past two weeks increased from 92 to 95 days. For homes priced between $4 million and $6 million, the Expected Market Time remained unchanged at 171 days. For homes priced above $6 million, the Expected Market Time increased from 260 to 326 days. At 326 days, a seller would be looking at placing their home into escrow around September 2024.