November 28, 2023
The active inventory, buyer demand, and the number of homeowners willing to sell have been bouncing around a bottom all year, so it is only up from here.
Housing is finally at a point where year-over-year statistics will isolate the slightest signs of improvement in the housing market.
For many, peanut butter is a delectable treat that is wonderful on crackers, toast, bananas, celery and an incredible additional ingredient in chocolate and cookies. The jar often gets to a point where it necessitates scraping the bottom for every last morsel. When it is this low, it is just a matter of time before everything changes; a new jar is opened, and there is plenty of peanut butter to dip into.
Housing is just like that peanut bar jar. The supply of available homes, the number of homeowners willing to sell, and buyer demand are all very low, scraping the bottom compared to normal levels before COVID and sky-high mortgage rates. The current trend lines for these metrics cannot get much lower than where they are today. They have been at these low levels all year. It is just a matter of time before they start to rise from this established bottom.
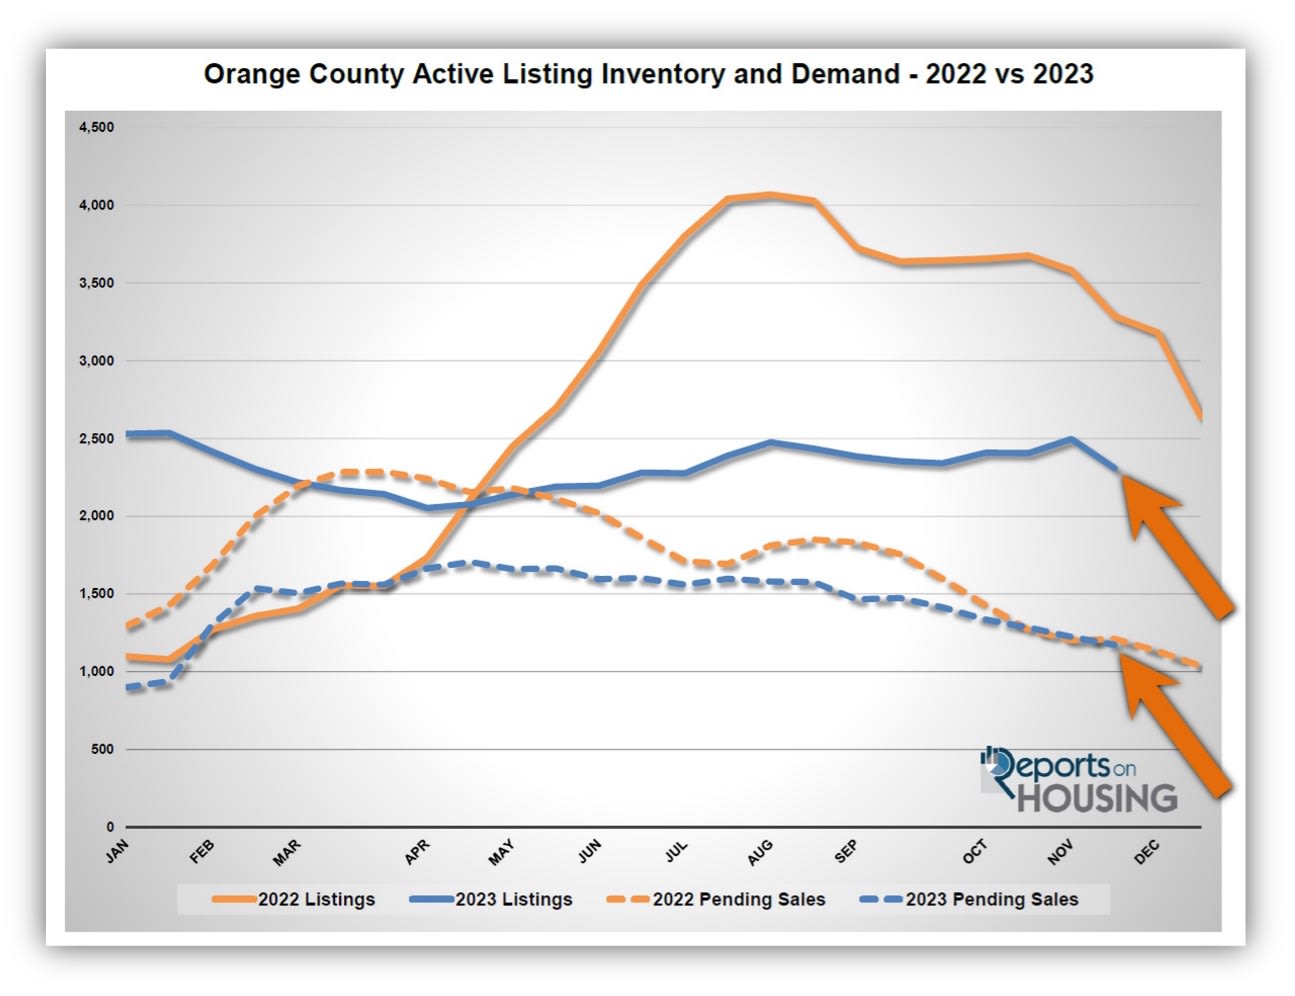
In October and November of last year, mortgage rates eclipsed 7% for the first time since 2001. They had risen from 3.25% in January 2022 to 7.37% at the end of October, drastically higher in a very short period. The quick erosion in affordability slammed on the brakes of a nuclear-hot housing market. Demand hit a March peak 30% below the average peak for 2020 and 2021. It was 19% below the 3-year average peak in demand before COVID (2017 to 2019). Before homeowners were able to adjust to the much lower demand levels, the inventory climbed from historical lows in January, with only 1,100 homes during the first week, to a peak of 4,069 in August, a 270% rise. It was 60% higher than 2021’s peak at 2,537 homes. Yet, it was still 42% below the 3-year average inventory peak before COVID of 6,959.
Demand in 2023 has been subdued all year due to the high mortgage rate environment and the lack of homeowners willing to sell. Demand has remained relatively flat, at bare-bones, inherent levels. There are always buyers in every market regardless of where rates climb. Year-over-year numbers have been nearly identical for the past month.
This year’s inventory has also remained relatively flat, dropping by 19% from January through April, when it usually rises. From there, it slowly climbed and did not peak until the beginning of this month at 2,496 homes, 1% below the start of this year. Year over year, there are a lot fewer homes on the market, bare-bones, inherent levels. Like demand, there are always sellers in every market regardless of underlying fundamentals.
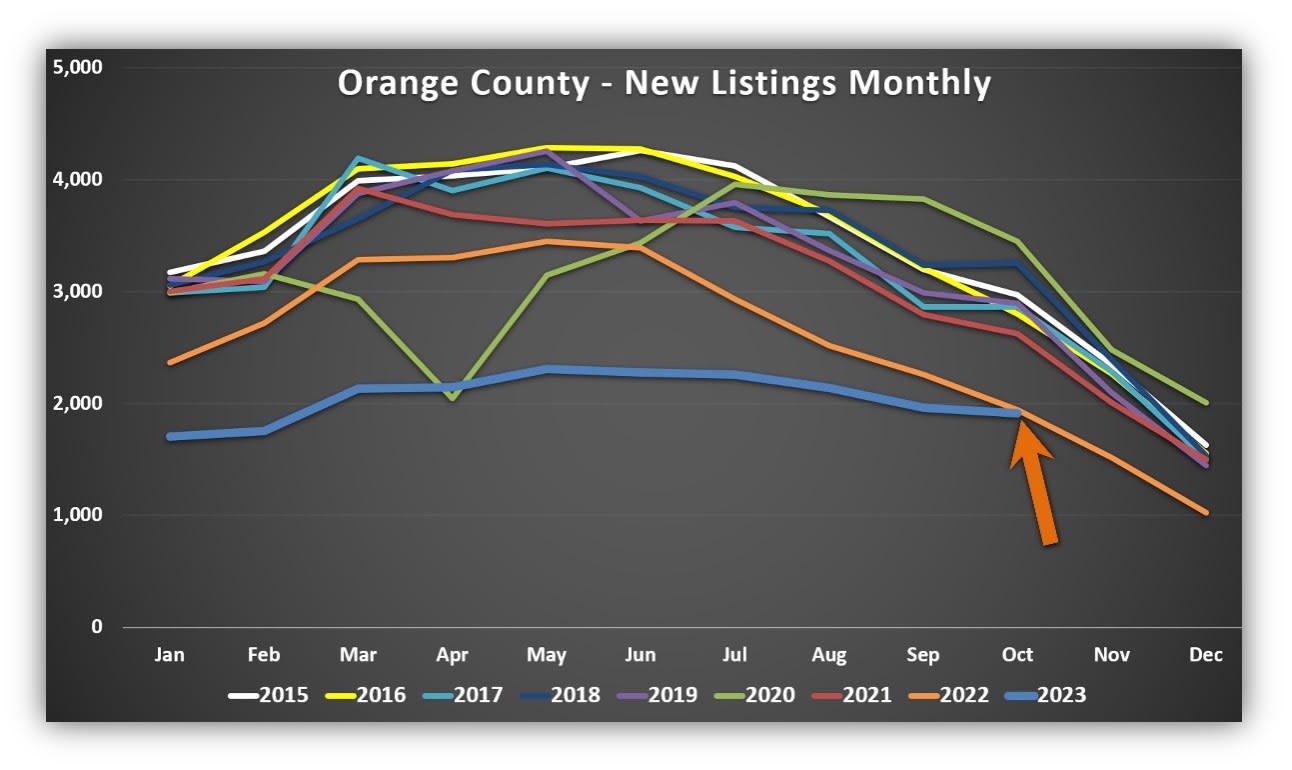
Another restrained statistic is the number of homeowners willing to sell. According to the Federal Housing Finance Agency’s National Mortgage Database, 85% of Californians with a mortgage have a rate of 5% or lower, 69% are at 4% or lower, and 30% are at 3% or lower. Consequently, fewer homeowners are selling their homes in the current high-rate environment. From January through October, 20,594 new sellers entered the market in Orange County, 14,800 fewer than the 3-year average before COVID, 42% less. Last year, there were 22% fewer sellers compared to the average. Yet, year-over-year comparisons were almost identical in October, with 1,910 sellers this year compared to 1,944 last year. Rates were above 7% both this year and last.
Annual comparisons will finally tell a story from this point forward. Housing is scraping the bottom in the number of homes available, buyer demand, and the number of homeowners willing to sell. Any rise in any of these metrics will provide quick insight into the housing market's direction. The economy is anticipated to cool a bit in 2024 from its hotter pace this year. For investors, a cooler economy typically means a flight to safe, long-term investments, 10-year bonds, and mortgage-backed securities. This flight to safety results in mortgage rates falling. As rates fall, demand will rise. If rates fall enough, more homeowners will be willing to sell. It is just a matter of time before something finally changes, and there will be more activity in housing. It will not bounce along the bottom forever. A new jar of peanut butter will be opened.
The active inventory plunged by 7% in the past couple of weeks.
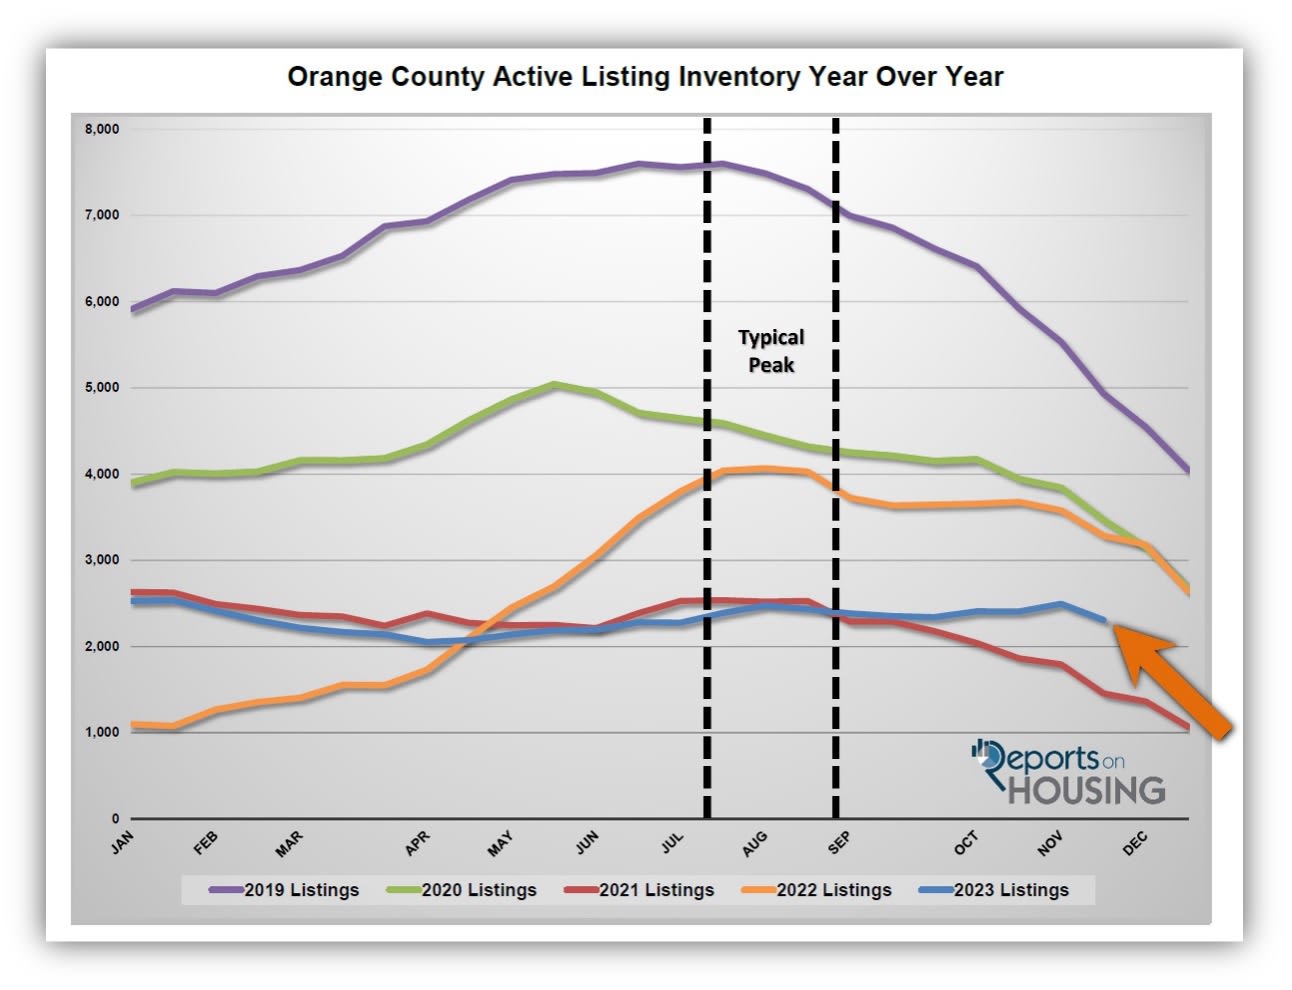
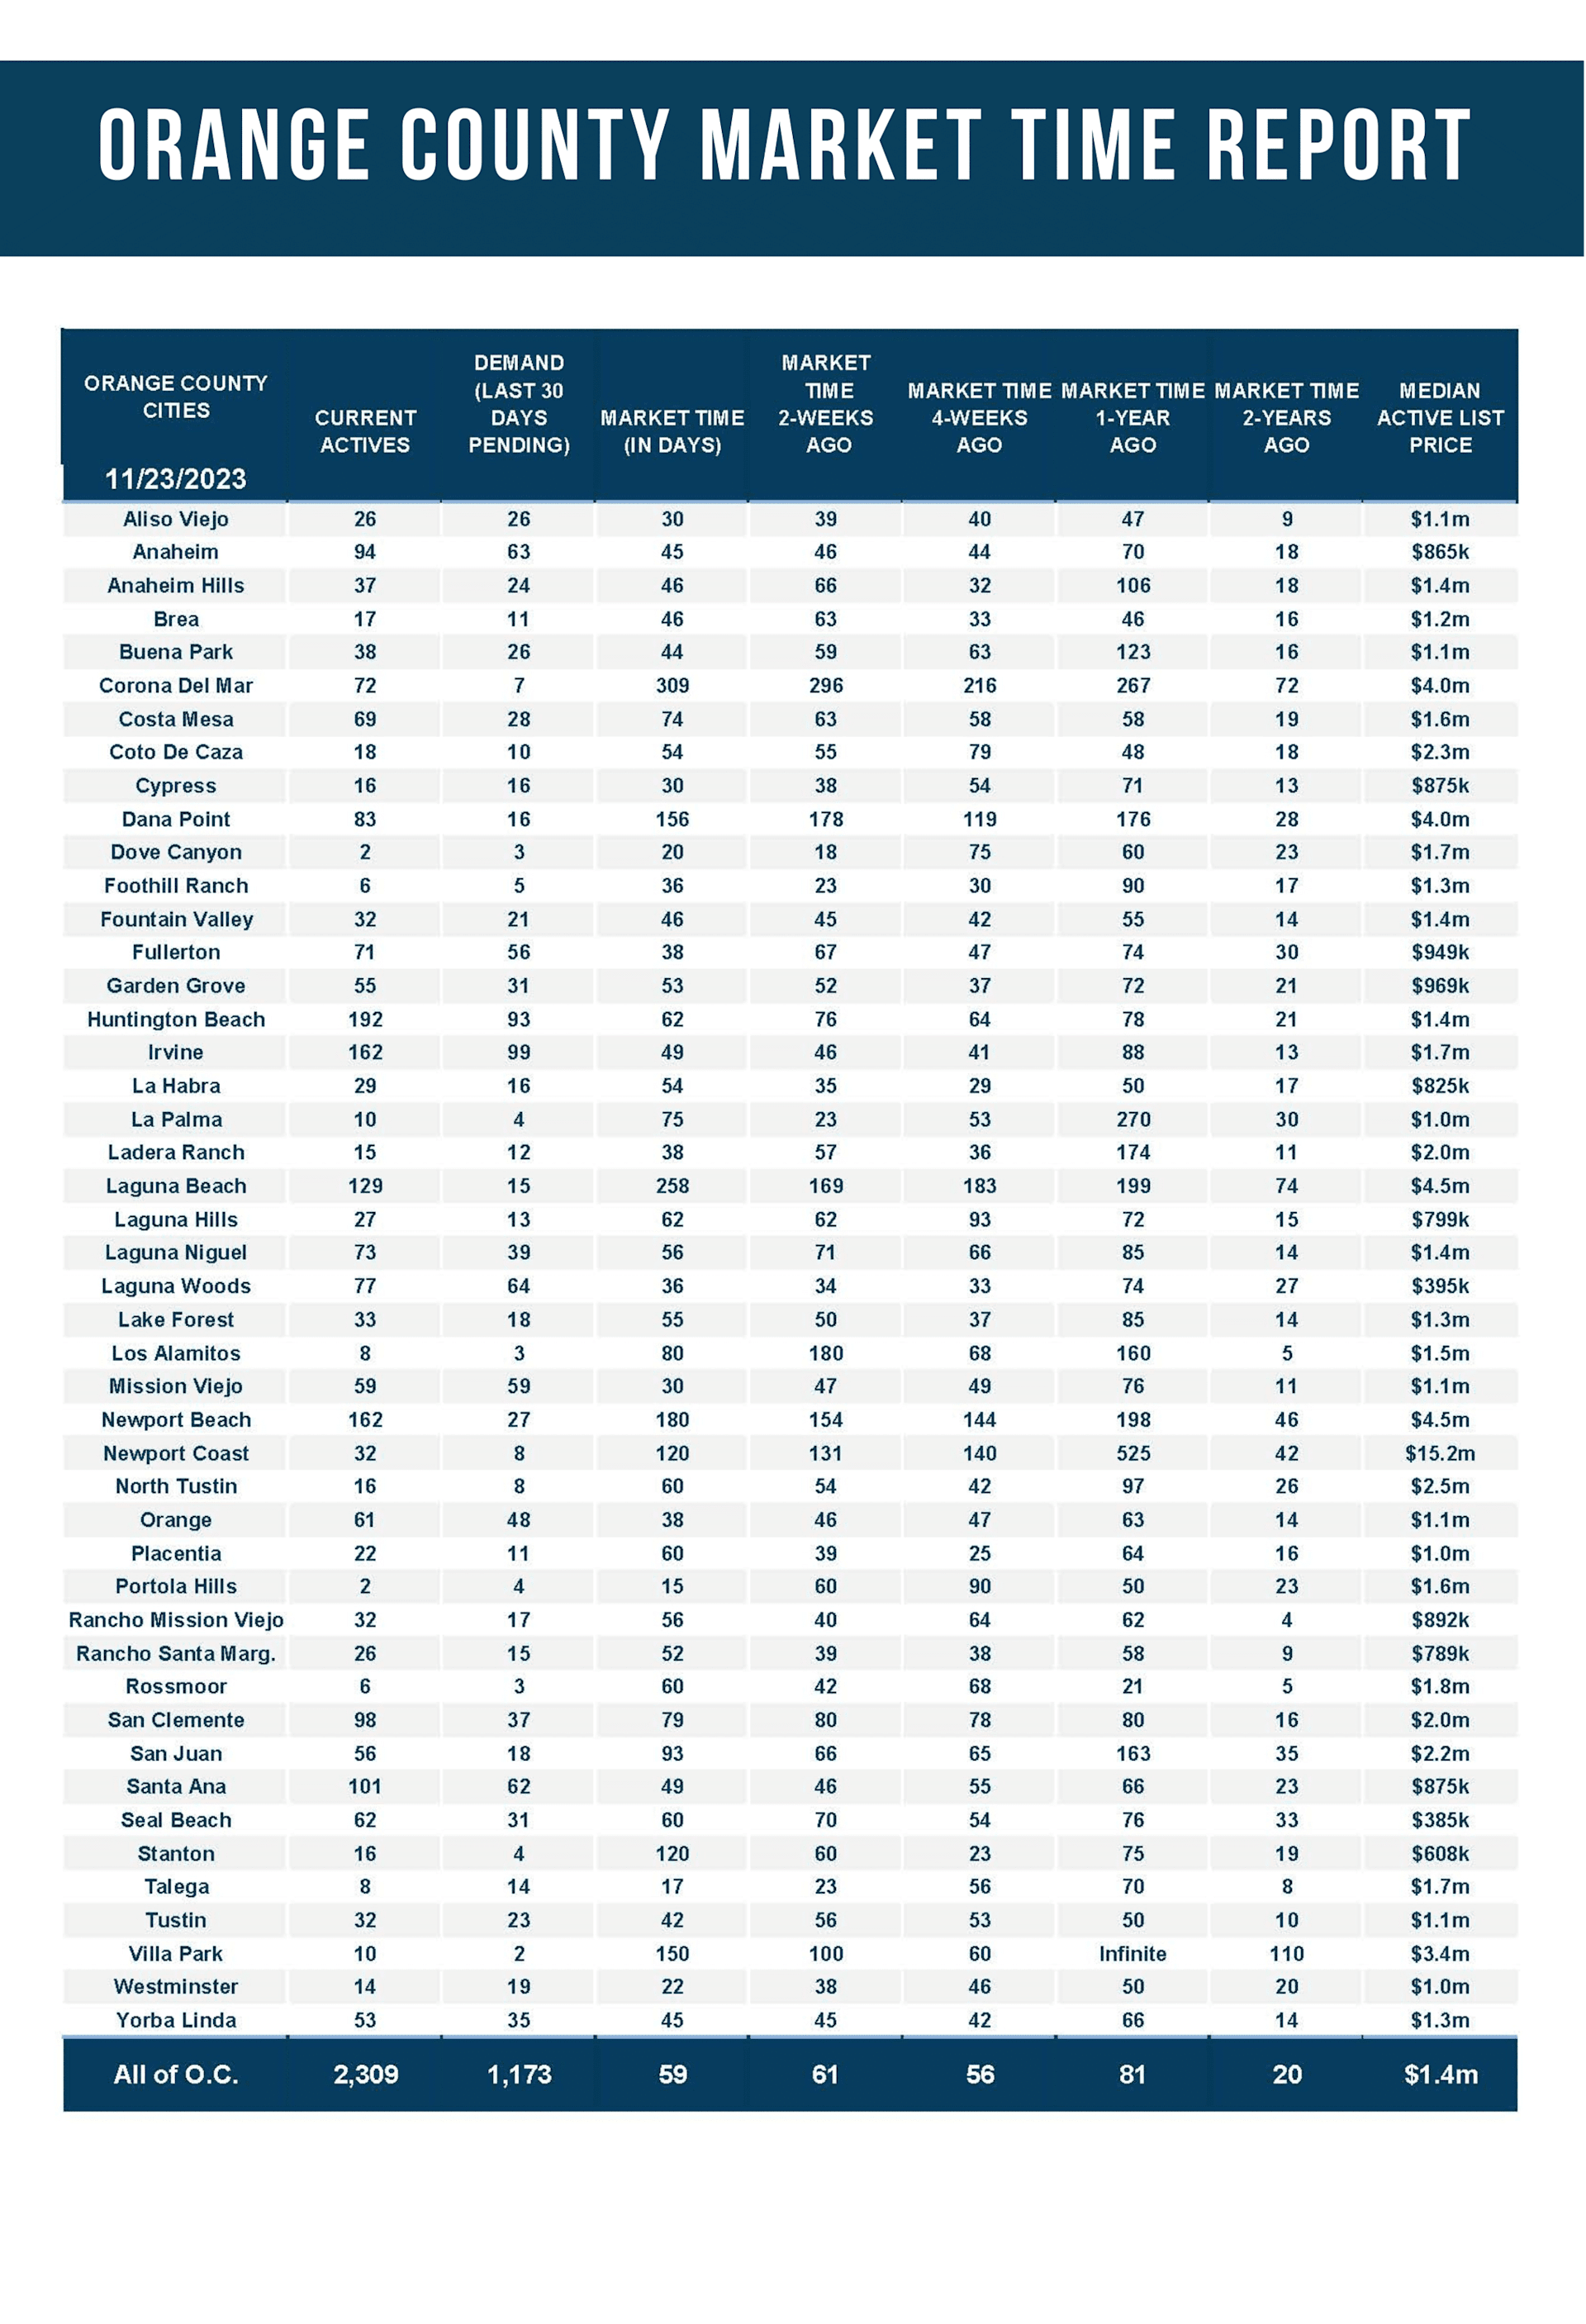
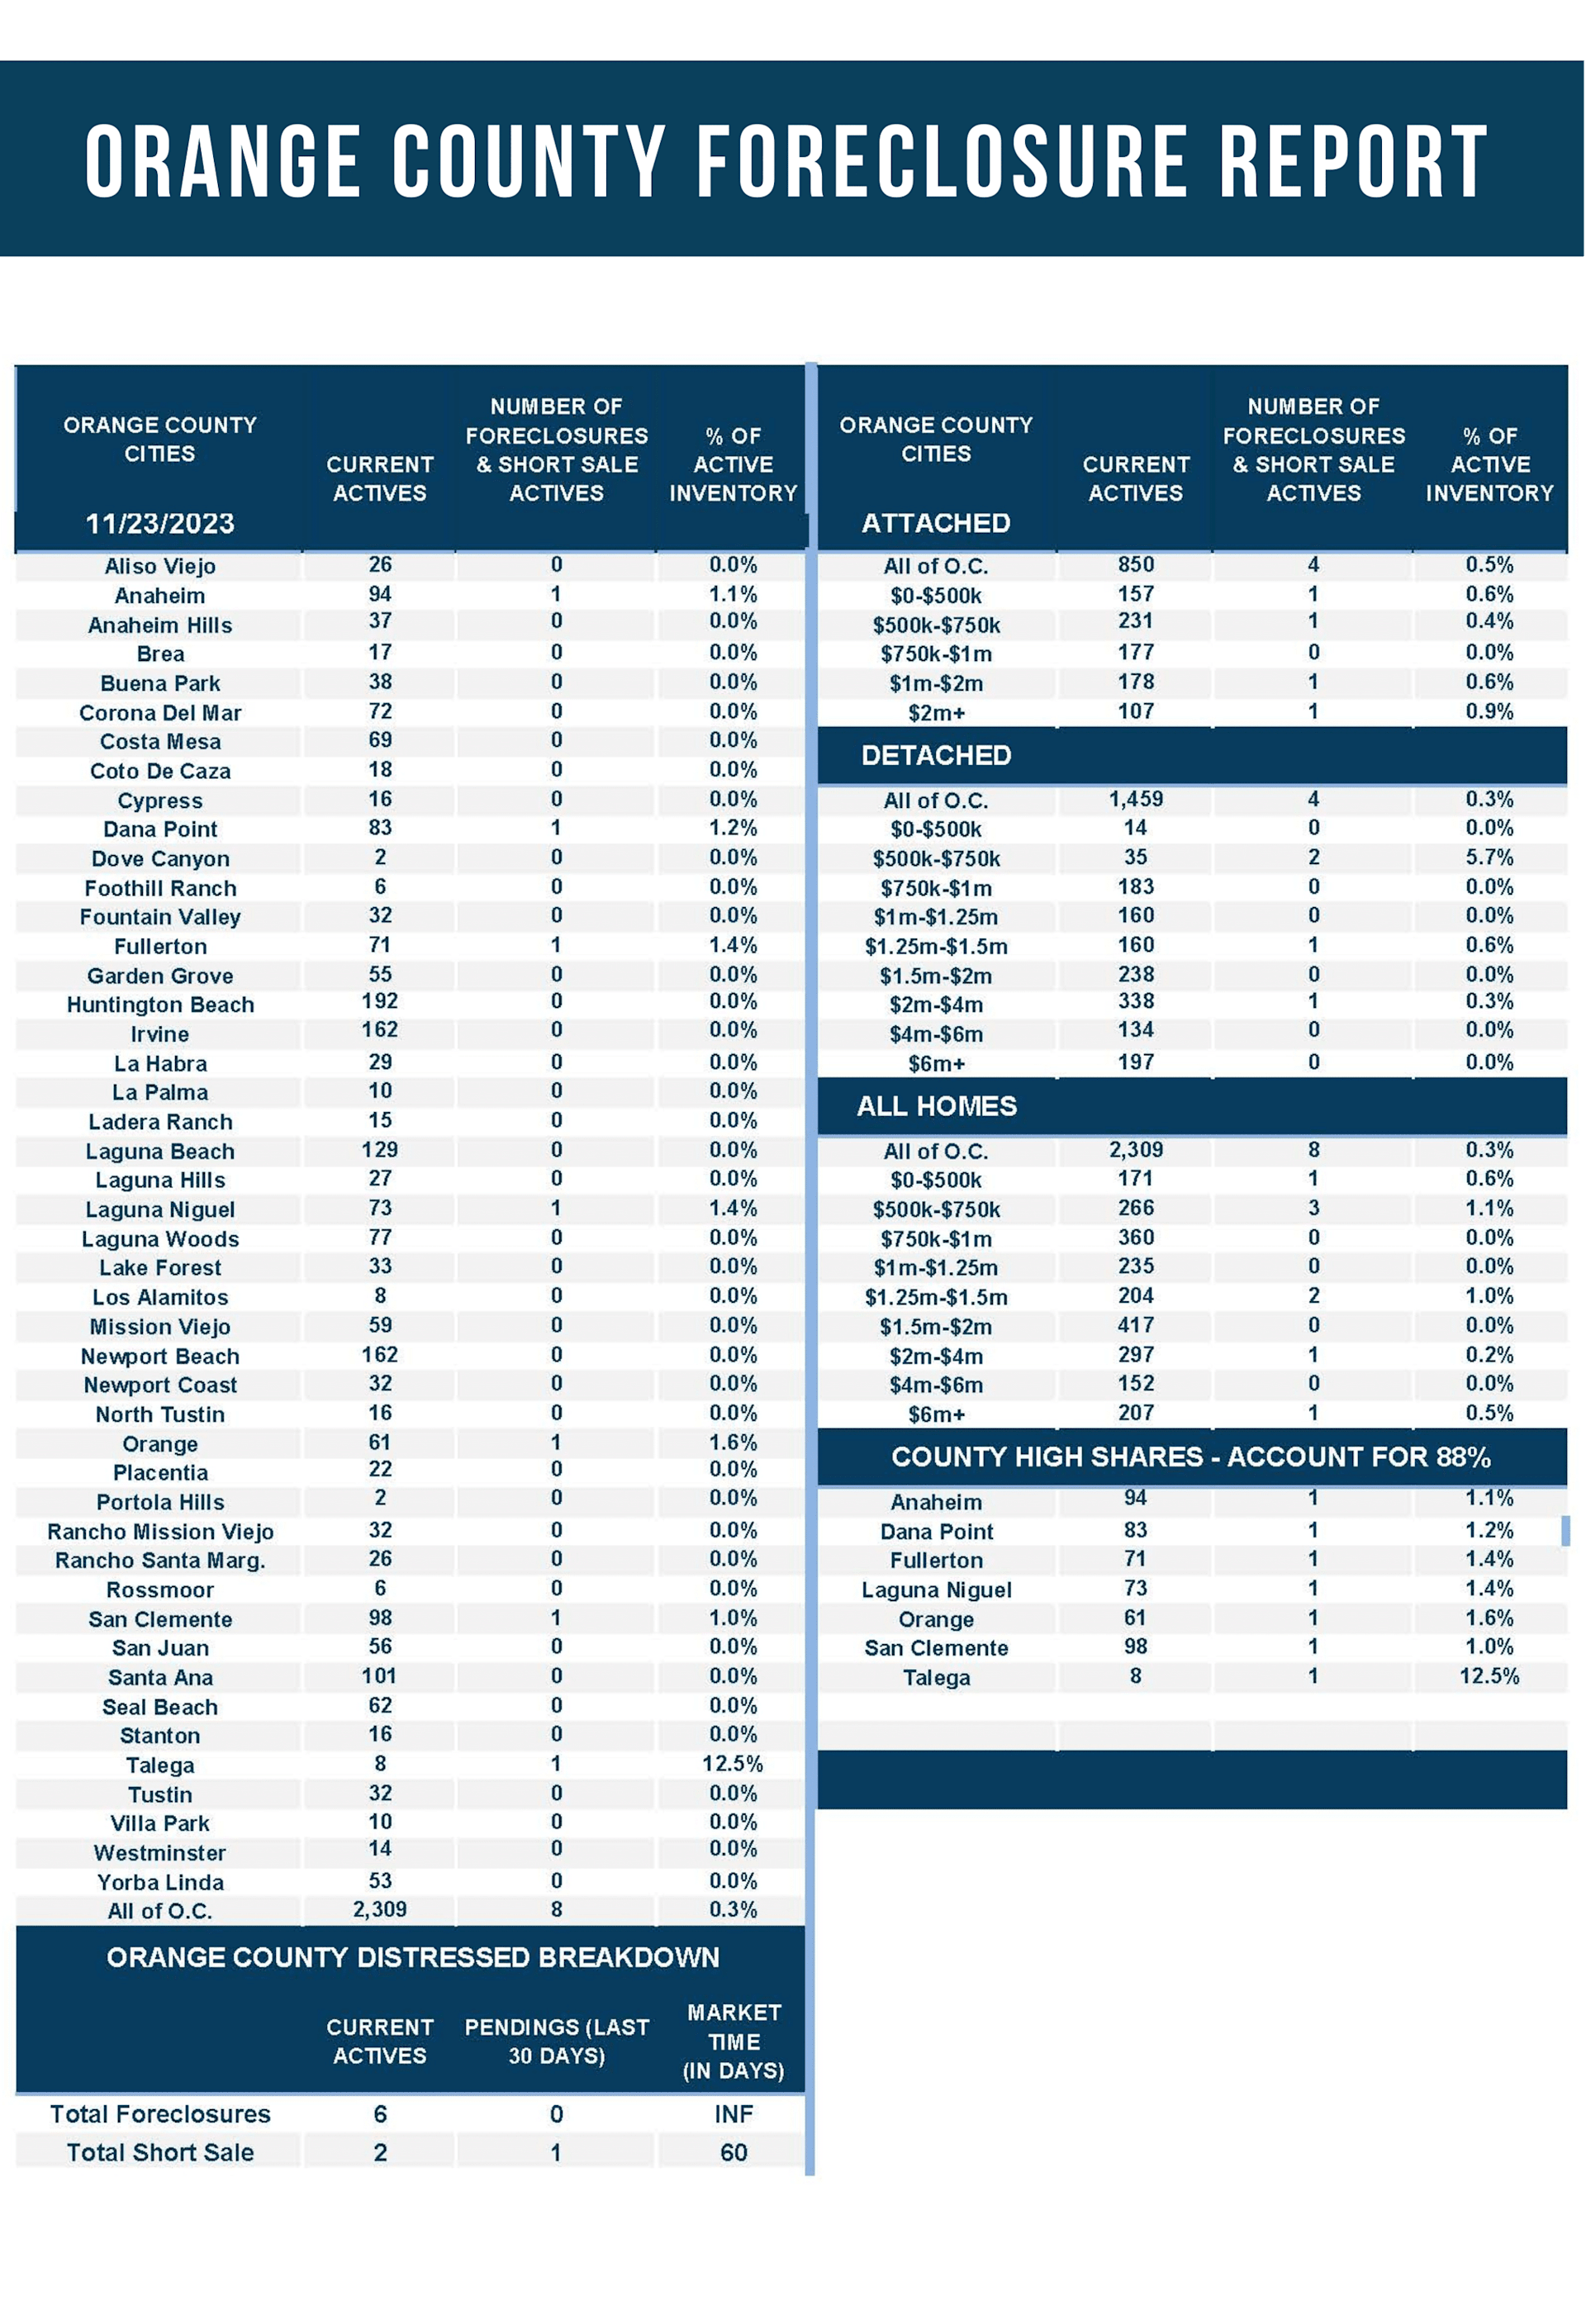
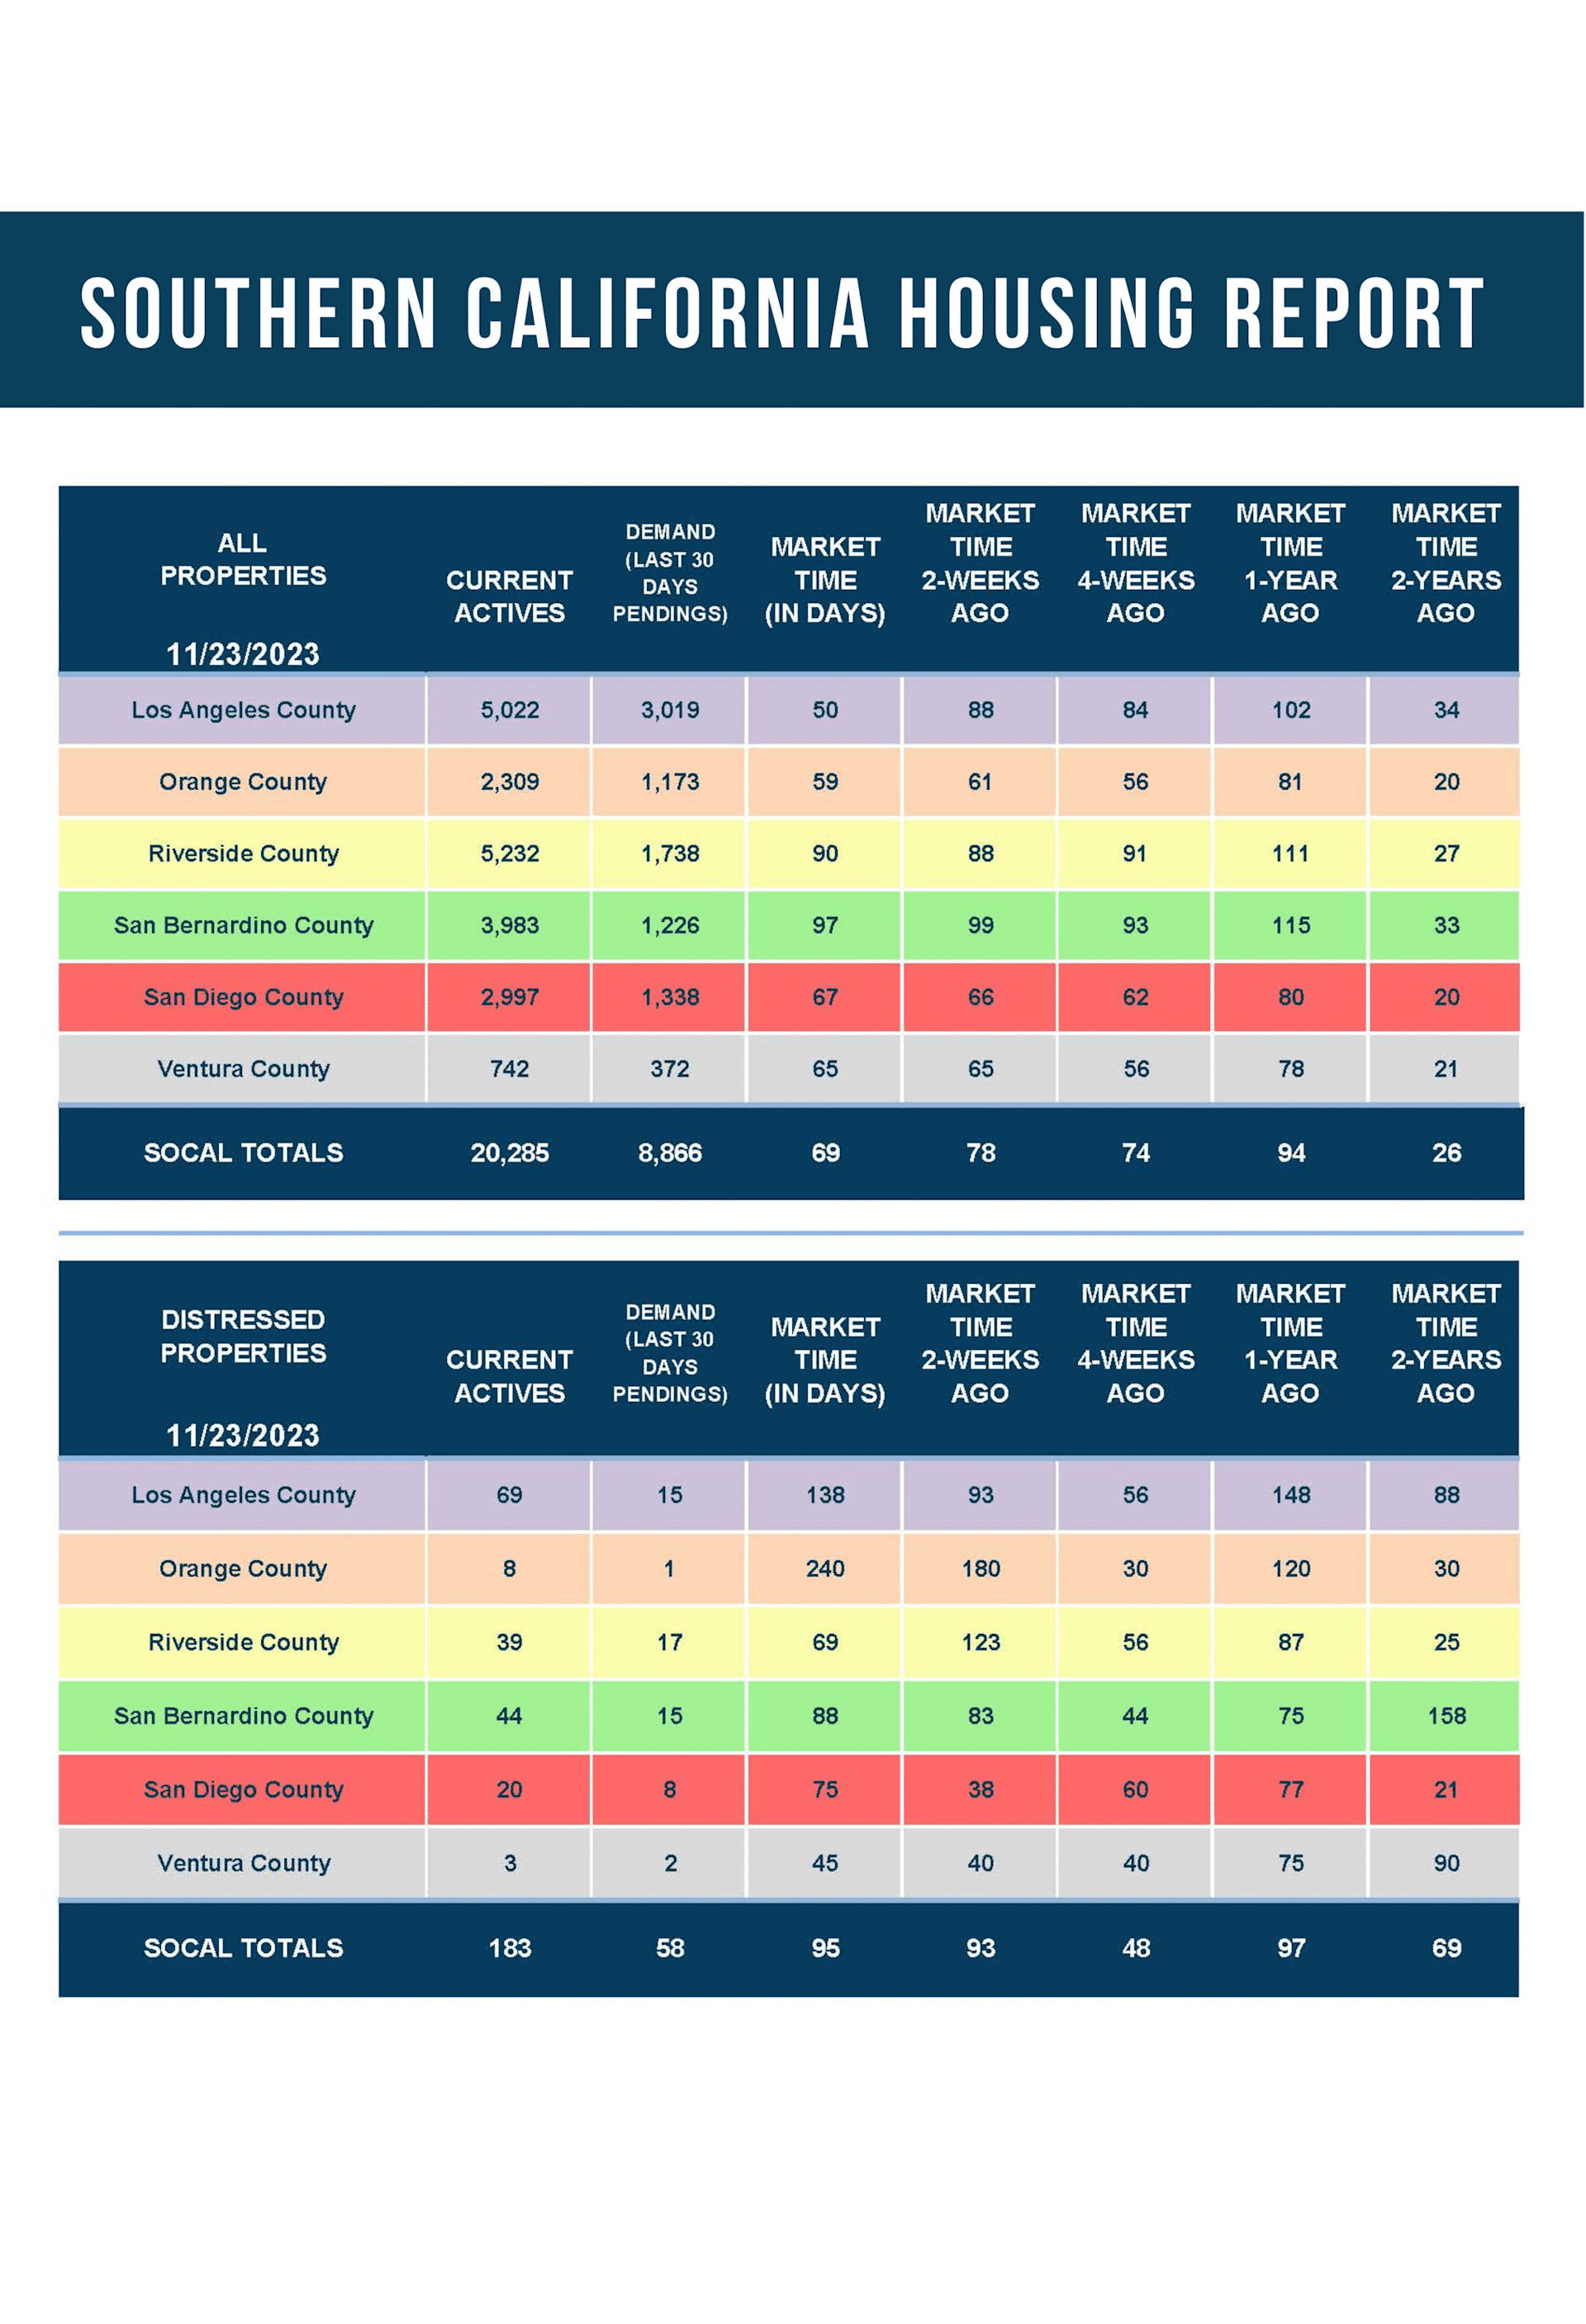
The active listing inventory plunged by 187 homes in the past two weeks, down 7%, and now sits at 2,309, its lowest level since the start of July. It was the largest drop so far this year. Orange County’s peak officially was reached at the beginning of this month, the latest peak since 2005. Regardless of the late peak, today’s inventory reading is far below the 3-year average before COVID (2017 to 2019) of 5,359 homes, an astounding 57% lower. It is the second-lowest November reading since tracking began in 2004, only behind 2021. The inventory will continue to plunge through the end of December due to cyclical trends of the fewest number of new sellers in November and December, along with unsuccessful sellers throwing in the towel so that they can enjoy the holidays. This means that 2024 will start with very few homes available to purchase.
Last year, the inventory was 3,286 homes, 42% higher, or 977 more. The 3-year average before COVID (2017 through 2019) is 5,359, an additional 3,050 homes, or 132% extra, more than double where it stands today.
Homeowners continue to “kick back” in their homes, unwilling to move due to their current underlying, locked-in, low fixed-rate mortgage. For October, 1,910 new sellers entered the market in Orange County, 1,093 fewer than the 3-year average before COVID (2017 to 2019), 36% less.
Demand dropped by another 4% in the past couple of weeks.
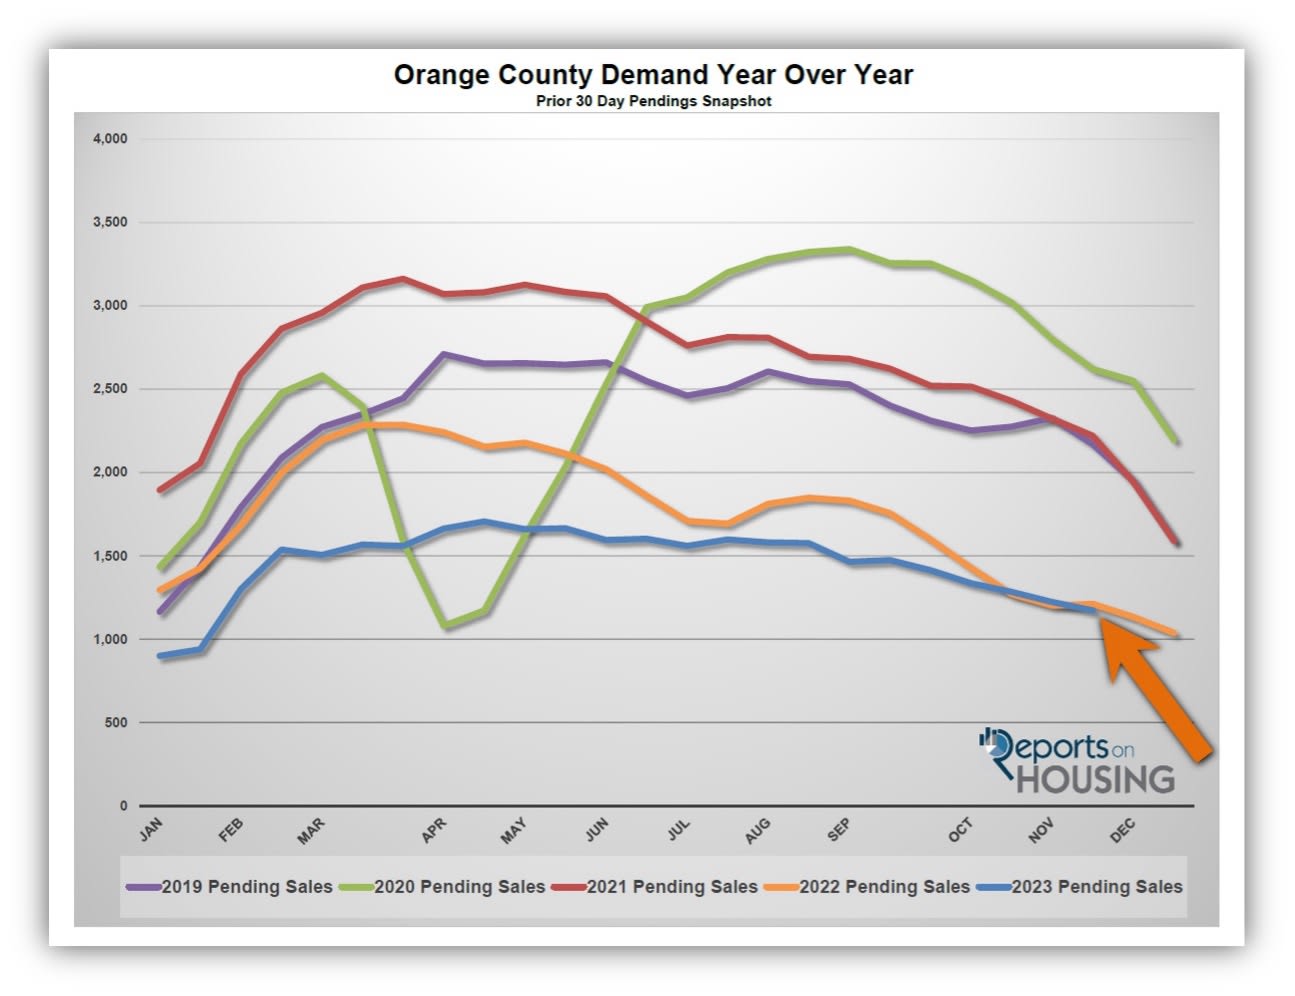
Demand, a snapshot of the number of new pending sales over the prior month, decreased from 1,223 to 1,173 in the past couple of weeks, down 50 pending sales, or 4%, its lowest November level since tracking began in 2004. Demand levels remain at very low, inherent levels. Buying demand is subdued because of the sky-high mortgage rate environment and the lack of homeowners willing to sell their homes. After eclipsing 8% last month, mortgage rates have retreated and dropped to 7.32% today. The direction of rates, if it continues to slide, bodes well for buyer demand in 2024. For the remainder of the year, expect demand to continue to drift downward slowly. Upon ushering in a New Year, demand will start to climb.
Last year, demand was at 1,212, 3% higher than today, or an extra 39 pending sales. The 3-year average before COVID (2017 to 2019) was 1,969 pending sales, 68% more than today, or an additional 796.
With the supply plunging faster than demand, the Expected Market Time (the number of days to sell all Orange County listings at the current buying pace) decreased from 61 to 59 days in the past couple of weeks. Last year, the Expected Market Time was 81 days, slower than today. The 3-year average before COVID was 85 days, also slower than today.
The luxury market slowed in the past couple of weeks.
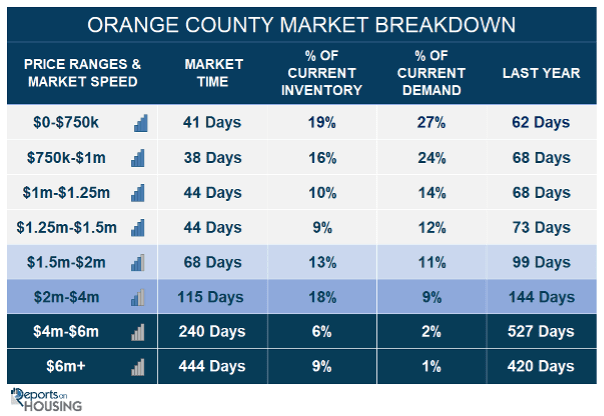
In the past couple of weeks, the luxury inventory of homes priced above $2 million decreased from 819 to 776 homes, down 43, or 5%. Luxury demand decreased by 20 pending sales, down 12%, and now sits at 142, its lowest level since February. With demand falling faster than supply, the Expected Market Time for luxury homes priced above $2 million increased from 152 to 164 days, its highest level since January. At 164 days, the luxury market is far from instant and is much slower than the lower ranges. Careful pricing and plenty of patience are the best approaches to today’s luxury market.
Year over year, luxury demand is up by 32 pending sales or 29%, and the active luxury listing inventory is up by 46 homes or 6%. Last year’s Expected Market Time was 199 days, much slower than today.
For homes priced between $2 million and $4 million, the Expected Market Time in the past two weeks increased from 103 to 115 days. For homes priced between $4 million and $6 million, the Expected Market Time increased from 231 to 240 days. For homes priced above $6 million, the Expected Market Time decreased from 469 to 444 days. At 444 days, a seller would be looking at placing their home into escrow around February 2025.