December 11, 2023
It is the telling of two different markets, the incredibly hot lower price ranges due to low inventory versus the sluggishness of the luxury market and longer market times.
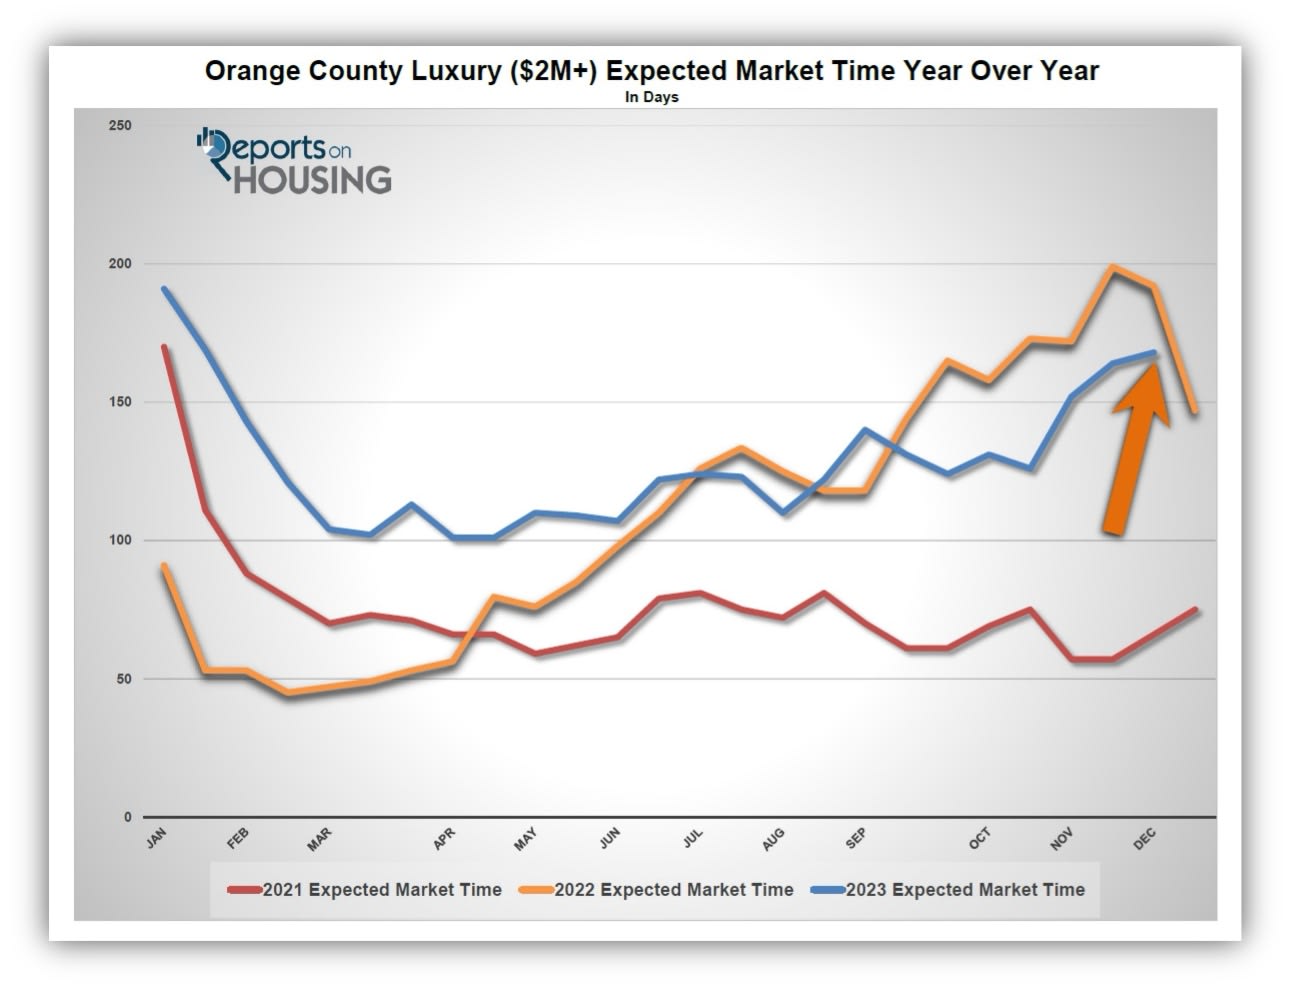
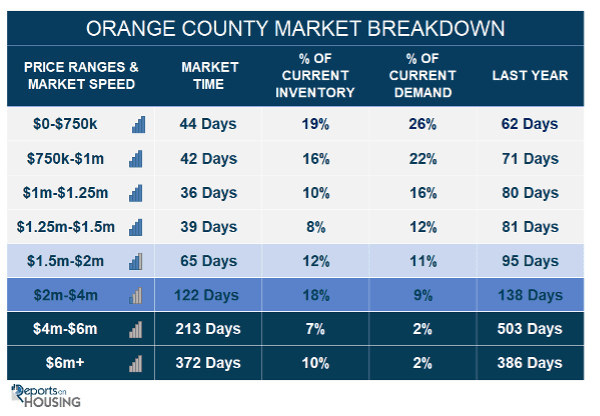
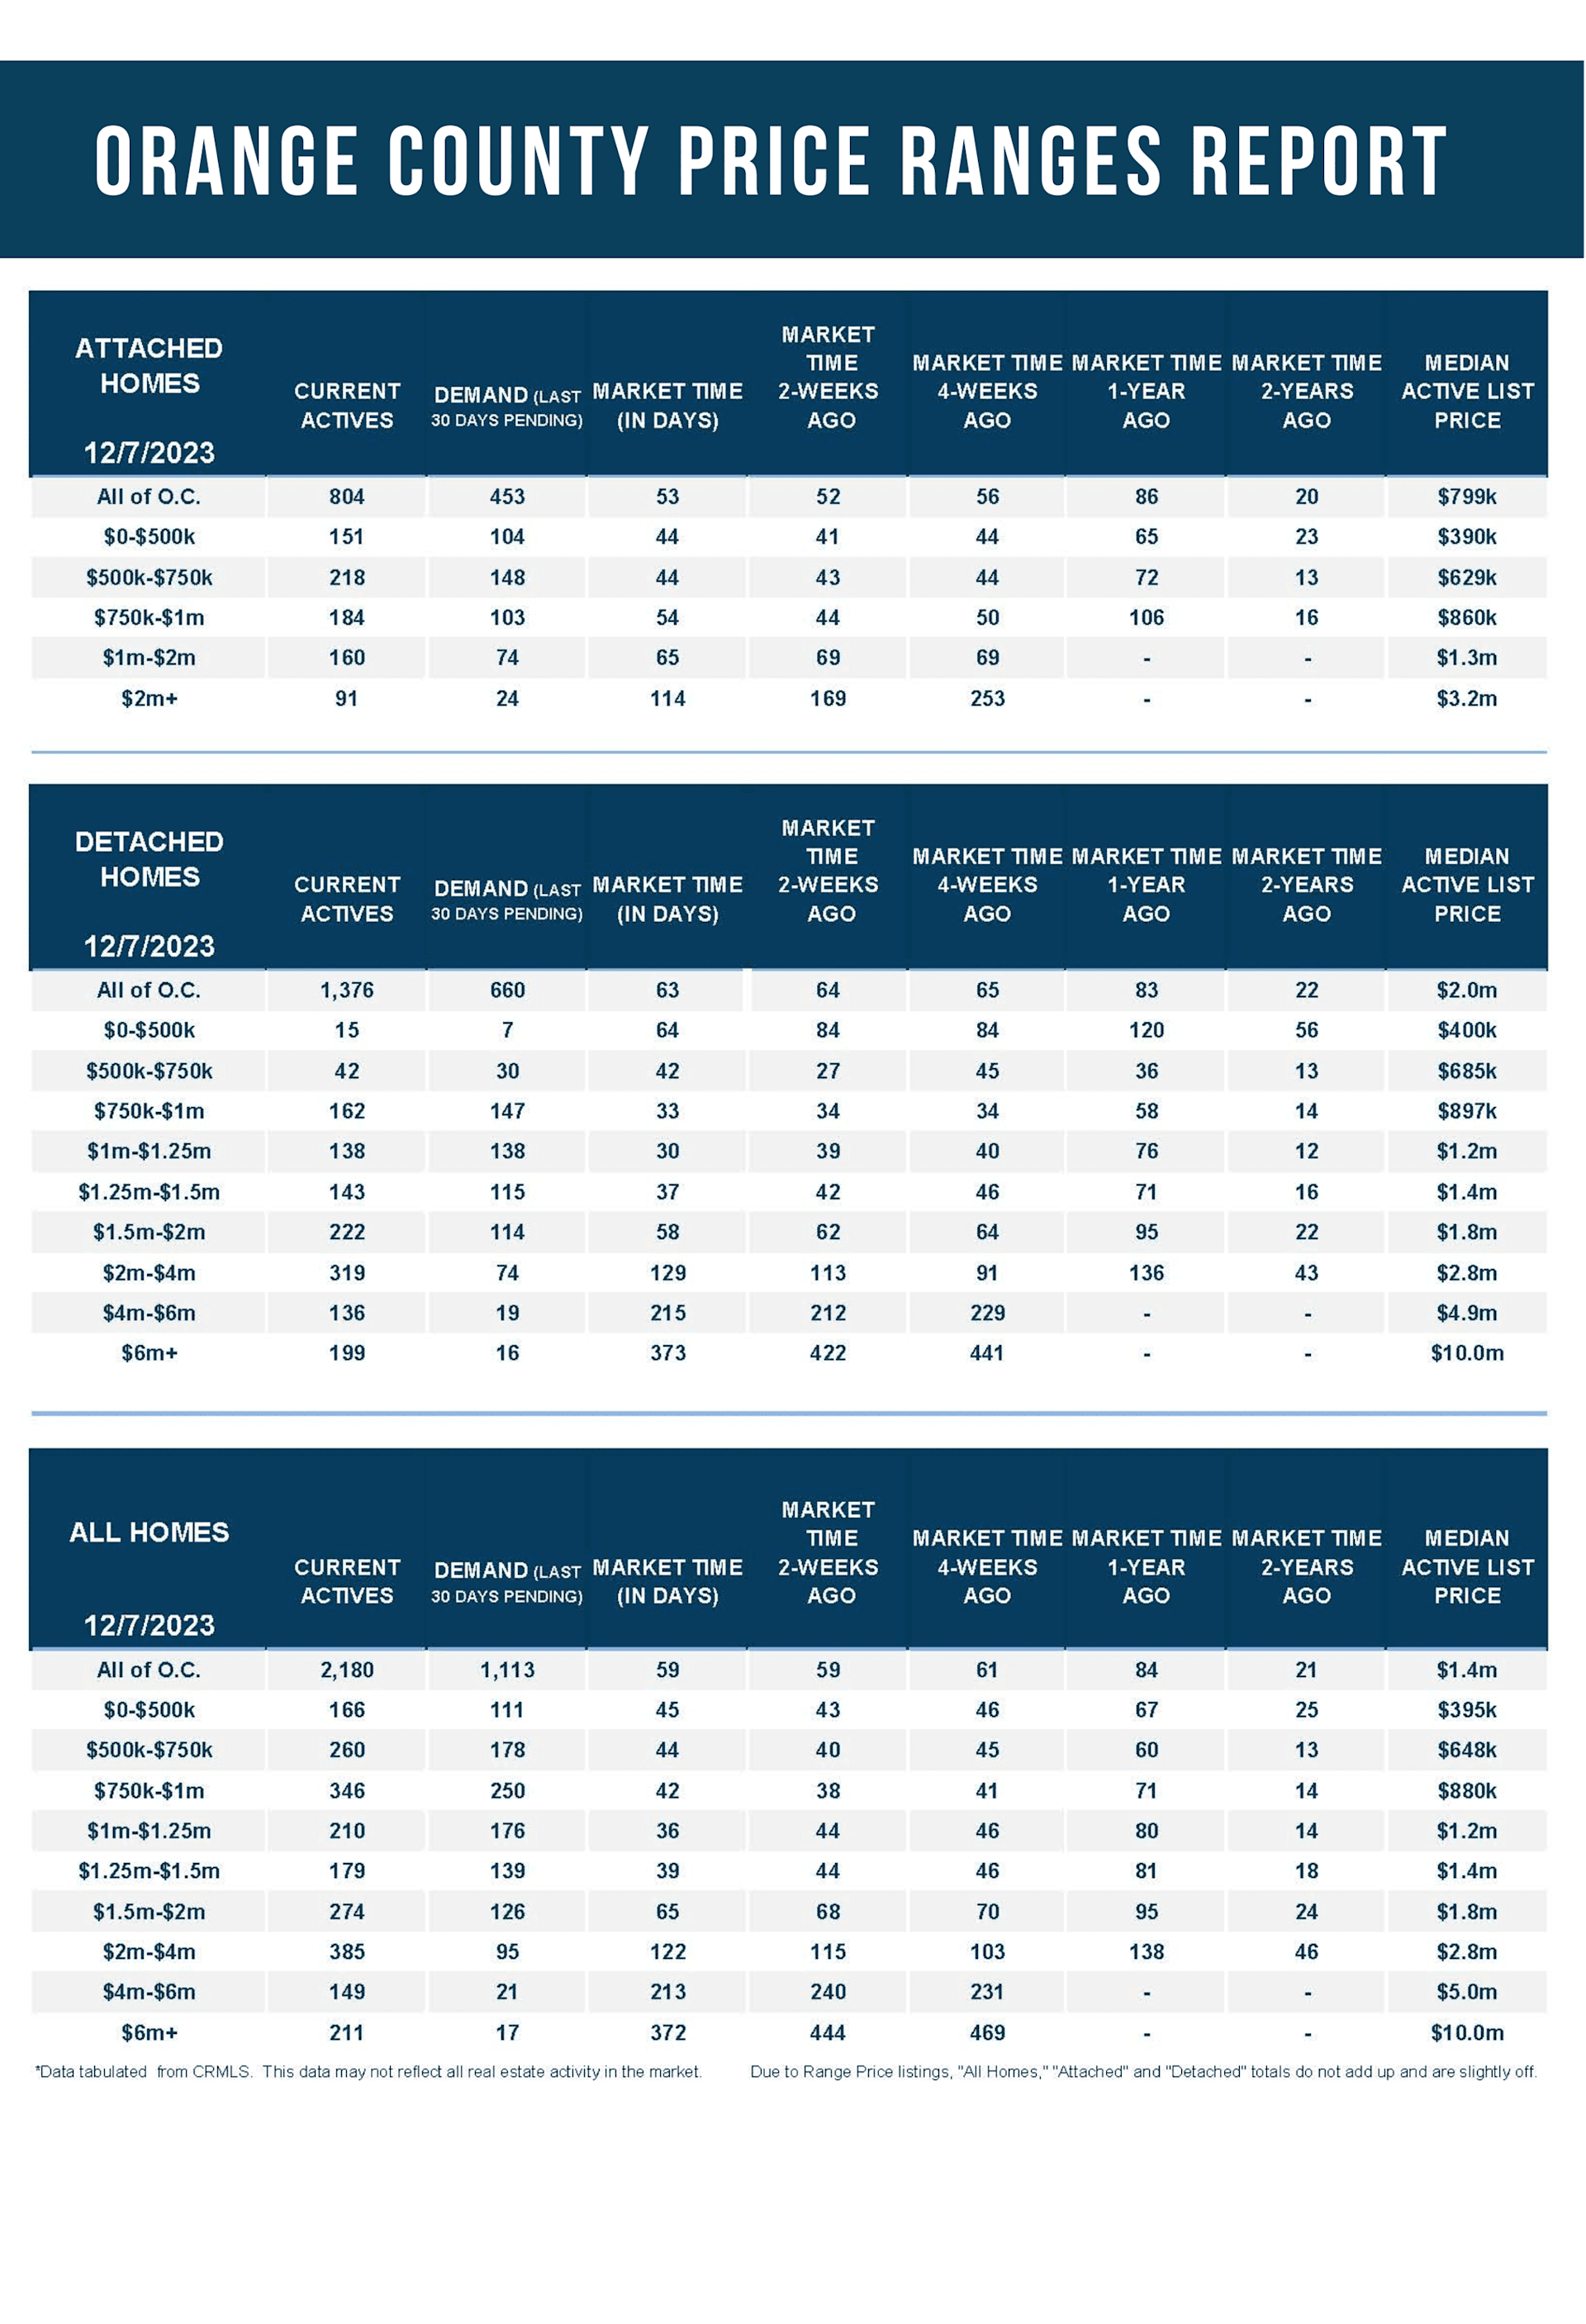
With an Expected Market Time of 168 days, nearly six months, the luxury housing market in Orange County is much slower than the lower ranges.
There is no wait time at the TSA security checkpoint at LAX. The drive-thru at Starbucks has no cars. The local favorite restaurant, typically booked for weeks ahead of time, has a table for two available for Friday night. It is sunny with no rain in the forecast, yet there is no wait when pulling up at the car wash. That just about sums up Orange County’s luxury housing market: there are simply not enough buyers compared to the number of sellers. Demand is low. There is no line of buyers waiting for another luxury home to be placed on the market.
The Los Angeles Times detailed how “Southern California home values near record despite the high cost of borrowing.” CNBC touts that “Home prices kept rising even as mortgage rates surged.” Yahoo Finance describes “Why the current housing market is a 'seller's paradise.'” It is understandable how luxury sellers have high expectations. The trouble is that these headlines describe the overall market and not luxury. Luxury today is a much different segment of housing.
The headlines can be confusing. They seem to paint a strong housing market for all price ranges. They are NOT reporting on the luxury market. The housing market is split between luxury and the rest of the market. Luxury housing, the top 10% of closed sales, homes priced above $2 million, is sluggish. Weekend open houses are not flooded with potential buyers. Multiple offers are not as common as the lower ranges. It is not unusual to go a week, or even weeks, without a single buyer touring a luxury home. There is not as much buyer competition.
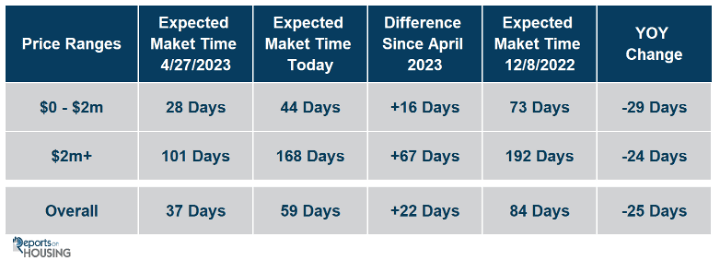
The Orange County housing market has cooled noticeably since the spring. From the end of April to today, the overall market slowed from an Expected Market Time (the number of days between coming on the market and pending status) of 37 to 59 days. On average, it takes 22 more days to sell a home. Yet, the differences are staggering in splitting the market between non-luxury and luxury. For homes priced below $2 million, this range has decelerated from 28 to 44 days, adding 16 days, a little over two weeks to the Expected Market Time. Yet, the luxury market moved from 101 days in the Spring to 168 days today, an extra 67 days. The lower ranges take a little over six weeks to sell today compared to 24 weeks for luxury, nearly six months.
Compared to last year’s 84-day Expected Market Time, the overall market is 25 days faster. The lower ranges are 29 days faster than last December’s 73 days. Luxury was 192 days last year, 24 days slower than today’s 168 days level. Thus, the housing market is stronger this December compared to last year.
The sluggishness of luxury today still feels a lot like a buyer’s market. Yet prices are not falling in the upper ranges. Luxury prices do not fall much at all when the market decelerates like it has this year because sellers stick to their guns and do not adjust their asking price as often as the lower ranges. Most high-end sellers state that they “don’t have to sell.” It is common for homes to sit for a very long time without a price reduction.
As is true in all price ranges, success is determined by motivation and a seller’s willingness to price their home according to its Fair Market Value. This value is calculated by carefully scouring all comparable pending and recent closed sales. Motivated sellers are unafraid to listen to the market and adjust the asking price when appropriate. Sellers willing to sharpen their pencil when it comes to price are much more likely to find success and achieve their objective in selling.
For most luxury sellers, it takes a lot longer to sell their homes successfully. There are a limited number of buyers looking for a luxury home. Sellers with the best price, terms, condition, location, and upgrades will stand out among the competition.
The market is split between luxury and the rest of the market. Luxury expectations should not be for instantaneous success, even with the right price. While it may be true for buyers looking to purchase a detached home below $1 million, there is not a line of buyers waiting to pounce on the next luxury home to come on the market. Instead, these sellers should focus on the data, statistics, and information that will help them navigate the more challenging luxury end.
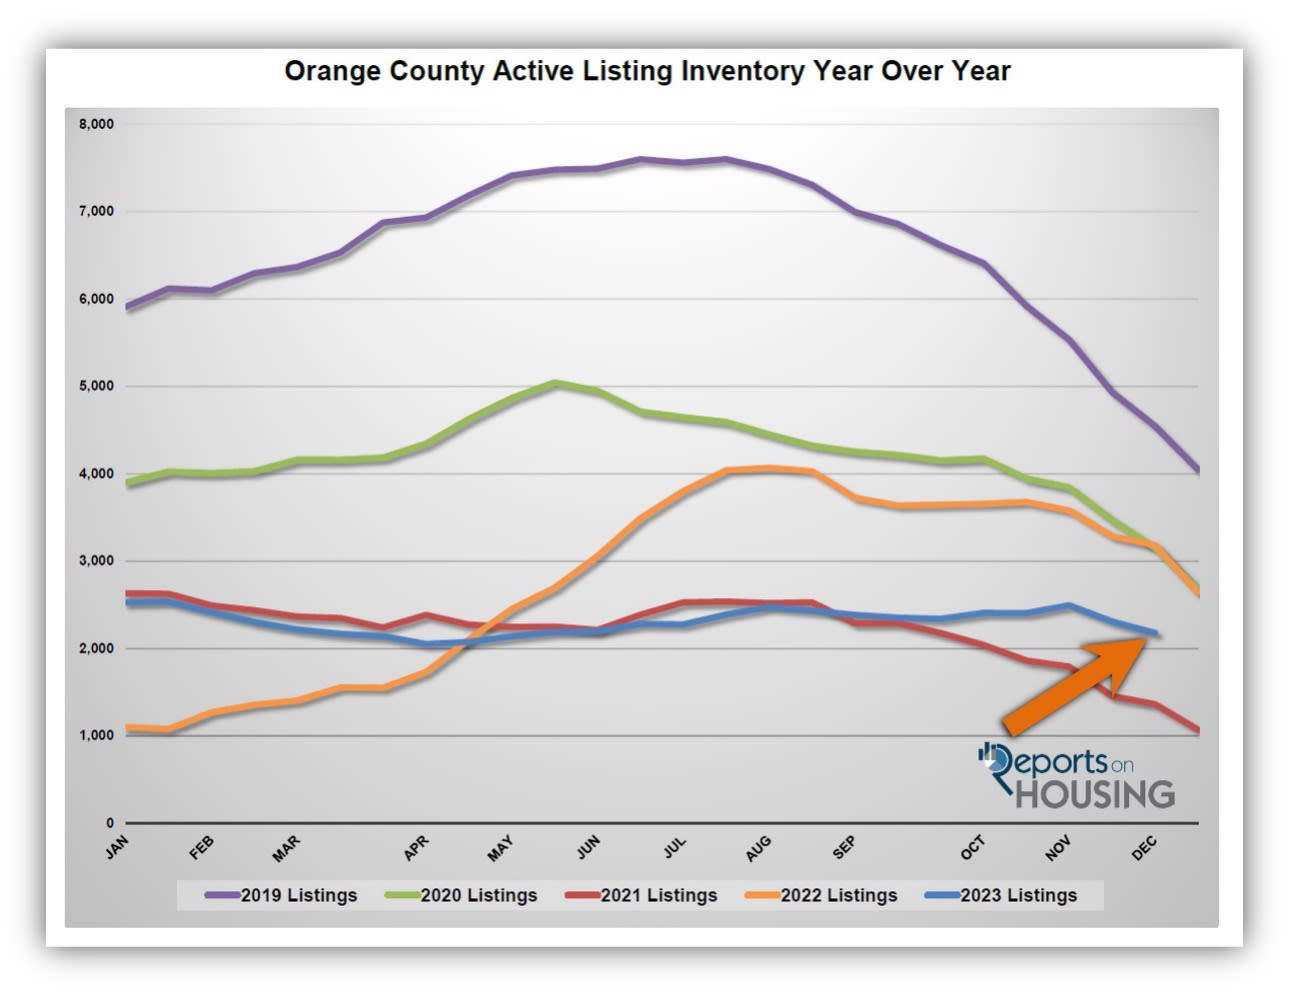
The active inventory dropped by another 6% in the past couple of weeks.
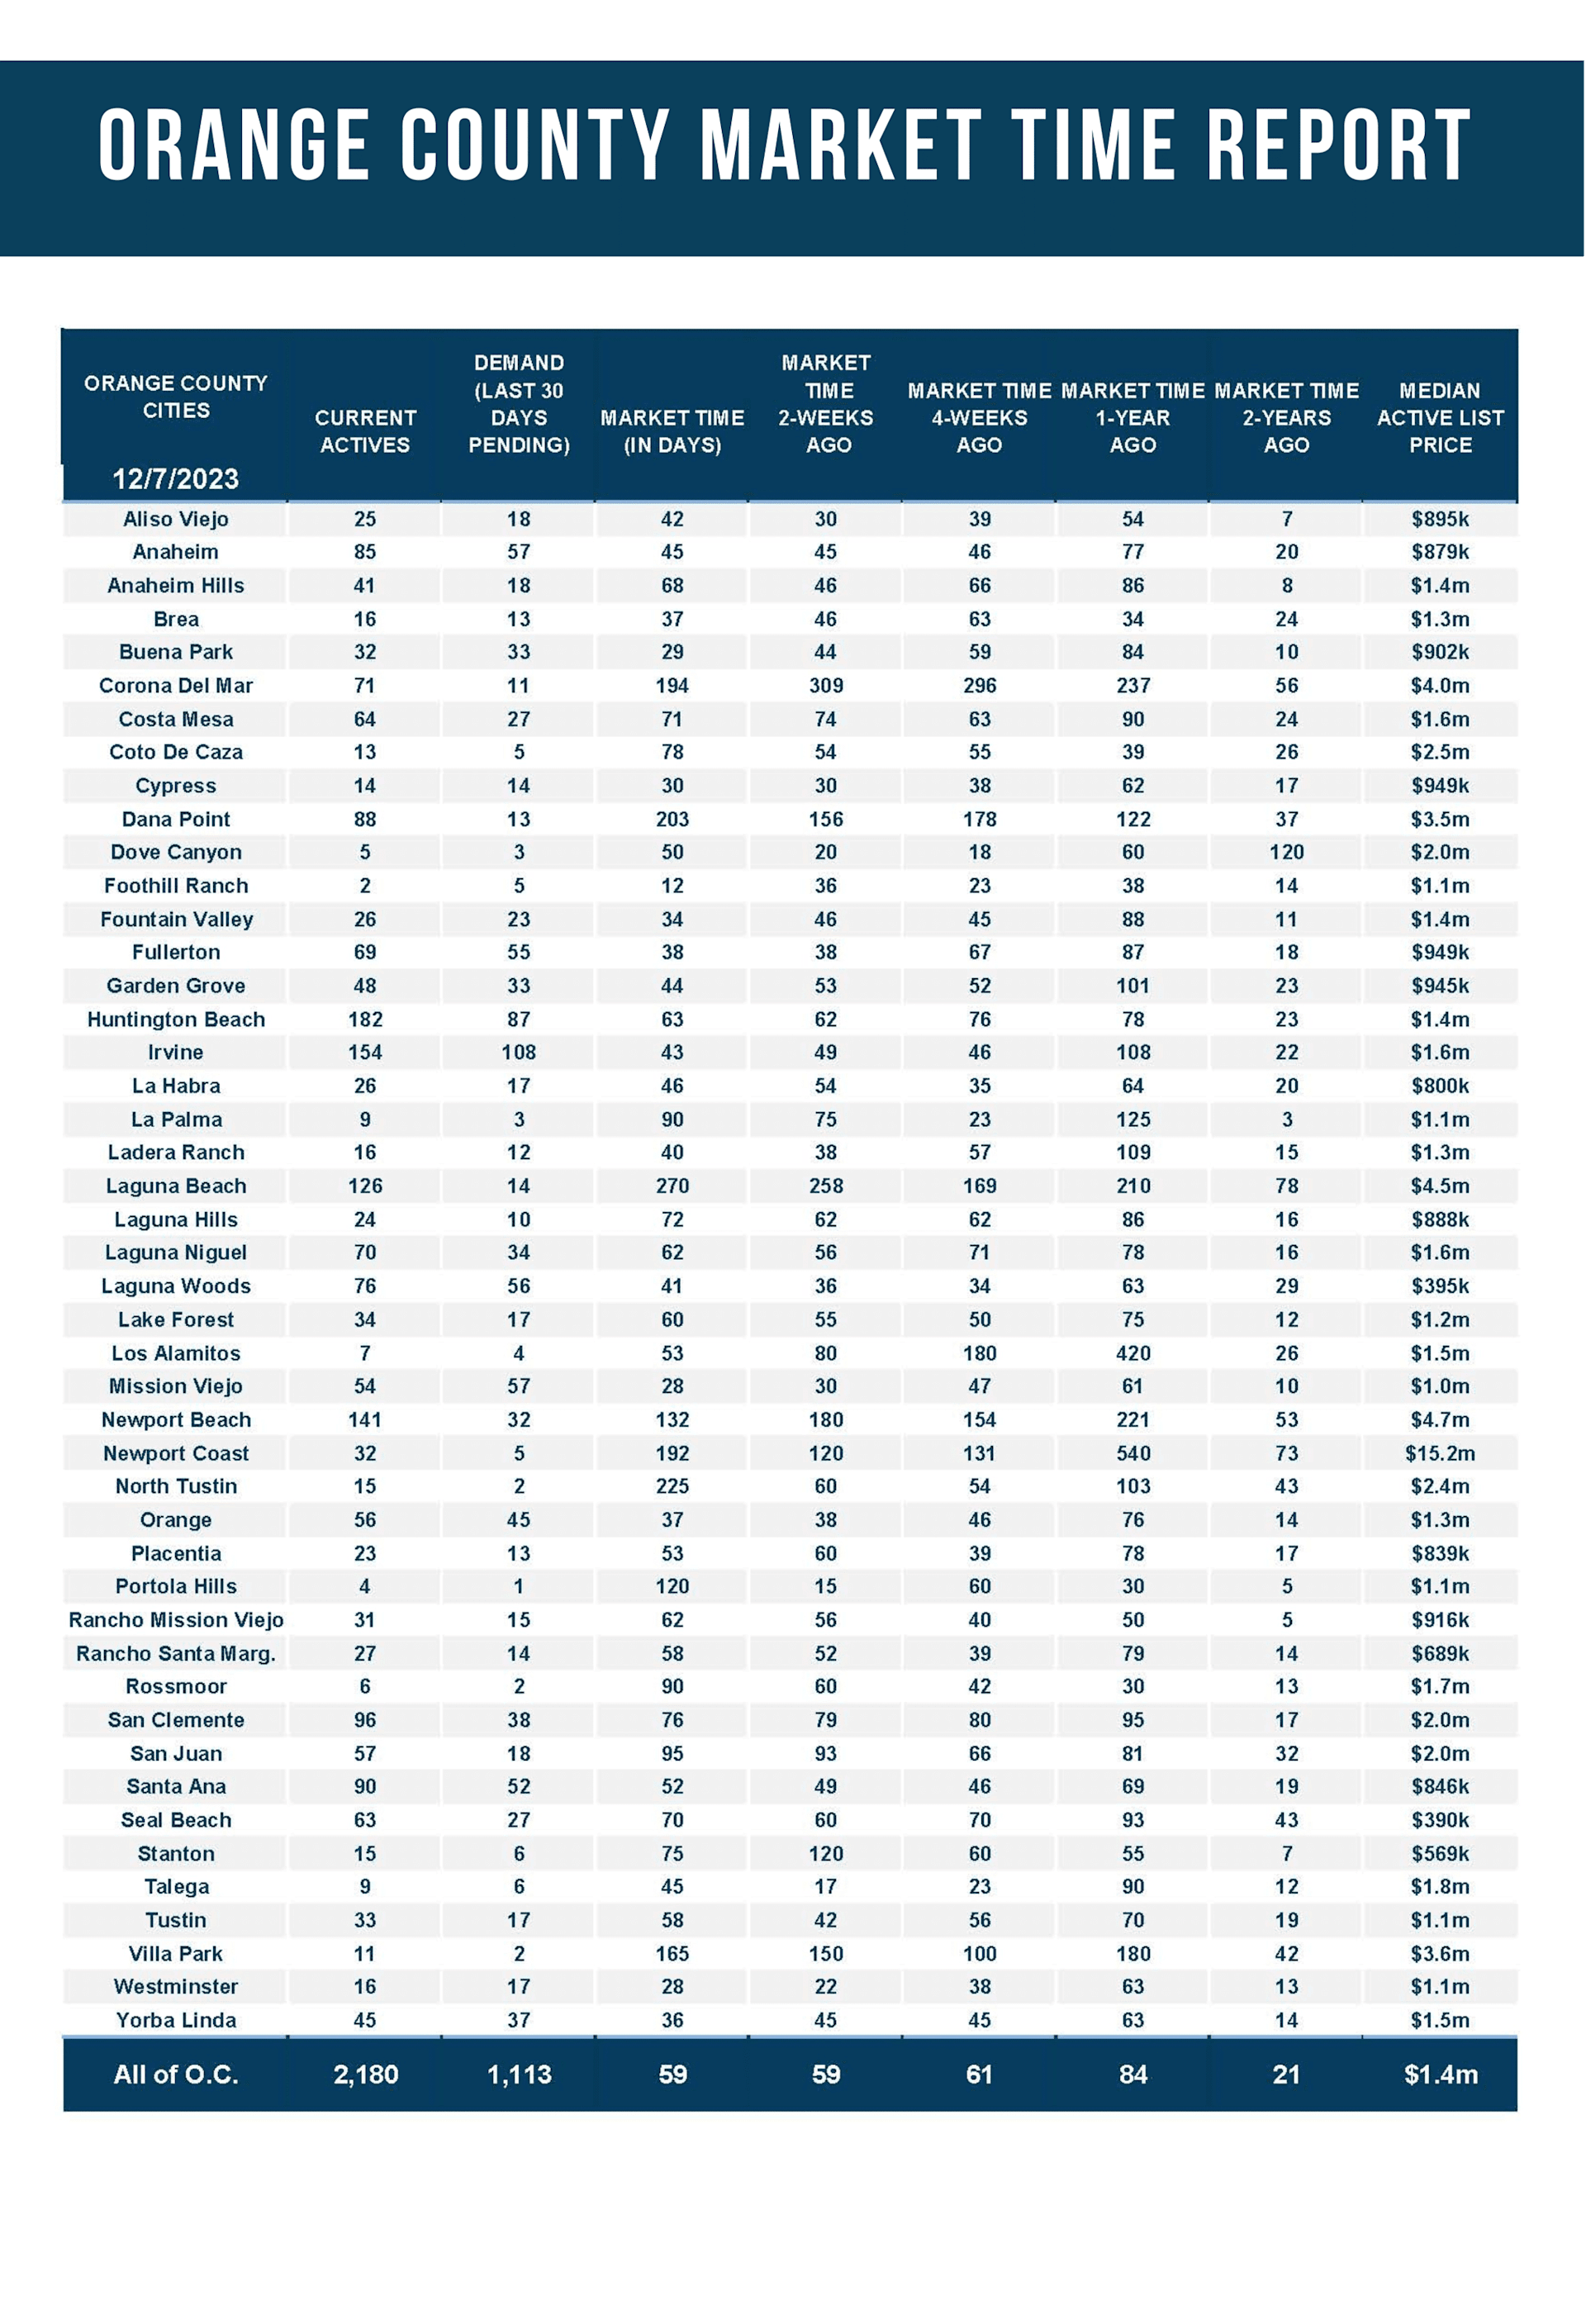
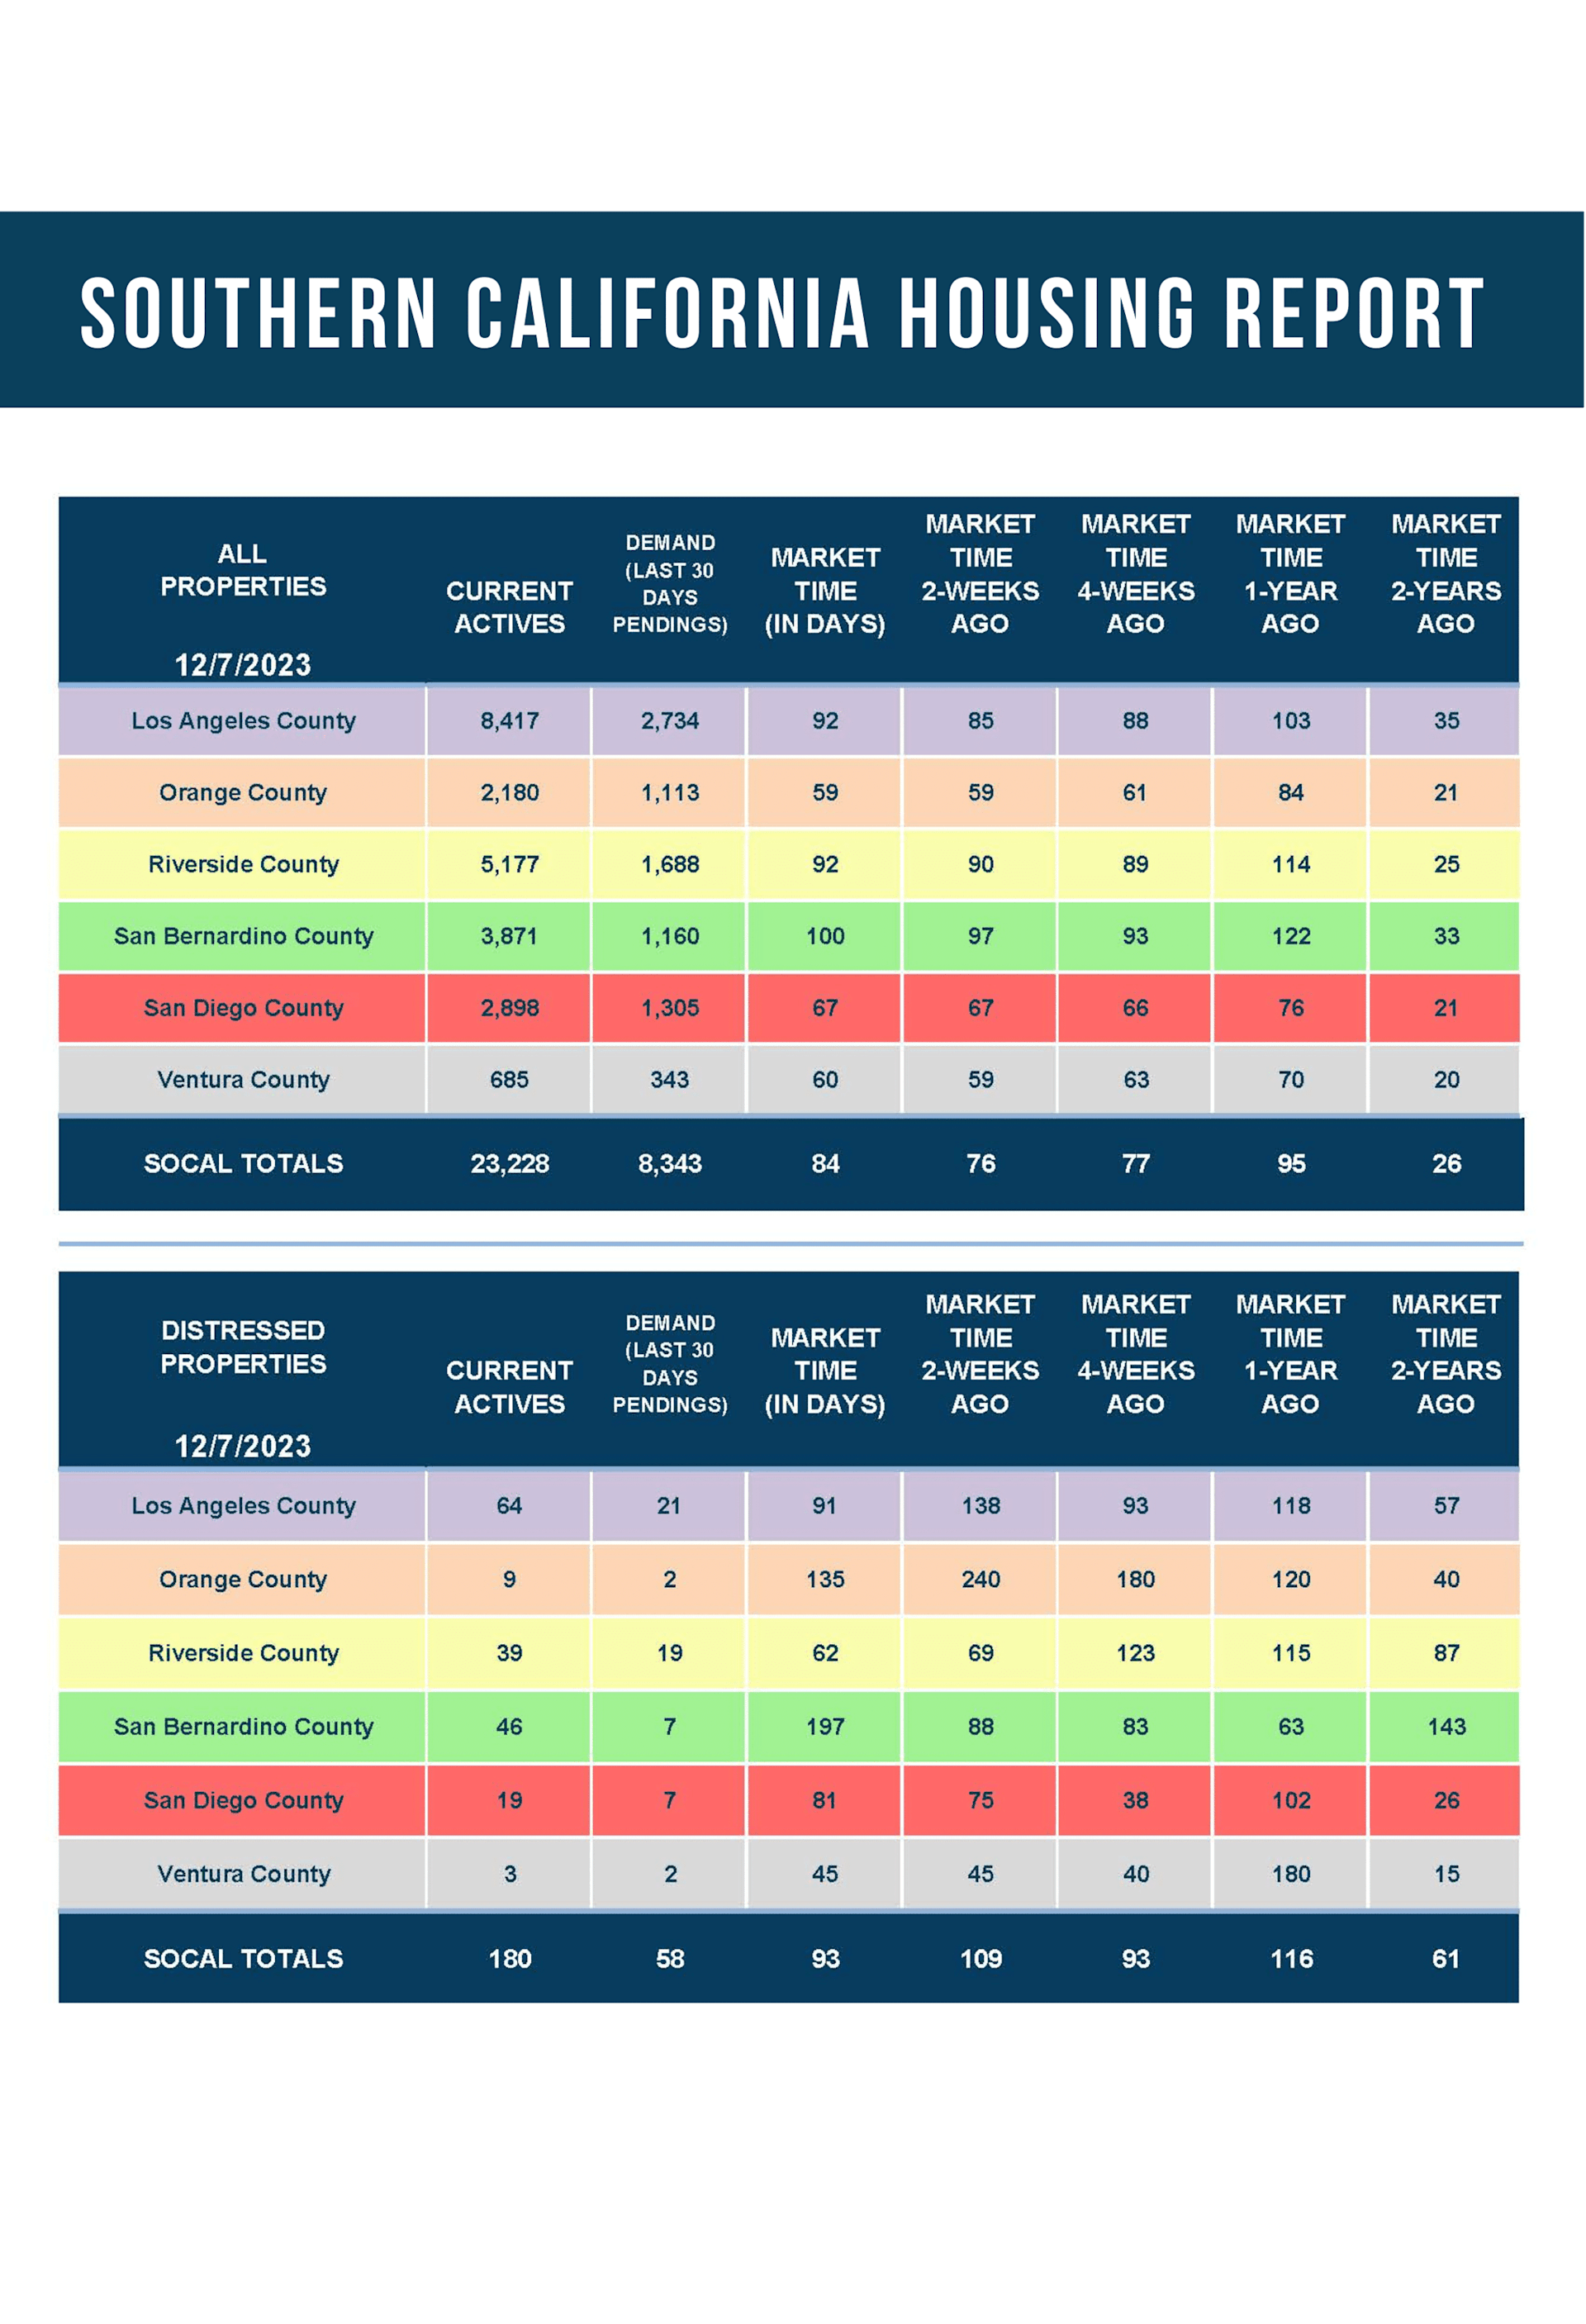
The active listing inventory plunged by 129 homes in the past two weeks, down 6%, and now sits at 2,180, its lowest level since May. It was the second largest drop of the year behind two weeks ago. Orange County is deep within the Holiday Market. December is when the fewest homeowners come onto the market and opt to sell their homes. It is also when many unsuccessful sellers pull their homes off the market to enjoy the holidays, ultimately postponing their real estate desires for a different time. Expect the inventory to plunge through the end of this year.
Last year, the inventory was 3,182 homes, 46% higher, or 1,022 more. The 3-year average before COVID (2017 through 2019) is 4,988, an additional 2,808 homes, or 129% extra, more than double where it stands today.
Homeowners continue to “kick back” in their homes, unwilling to move due to their current underlying, locked-in, low fixed-rate mortgage. For November, 1,511 new sellers entered the market in Orange County, 743 fewer than the 3-year average before COVID (2017 to 2019), 33% less. The kick back trend deepened in the second half of 2022. Year-over-year comparisons are much more relevant today. Last year, there were 1,521 new sellers, nearly identical to today. It will be much easier to isolate when more sellers finally enter the fray.
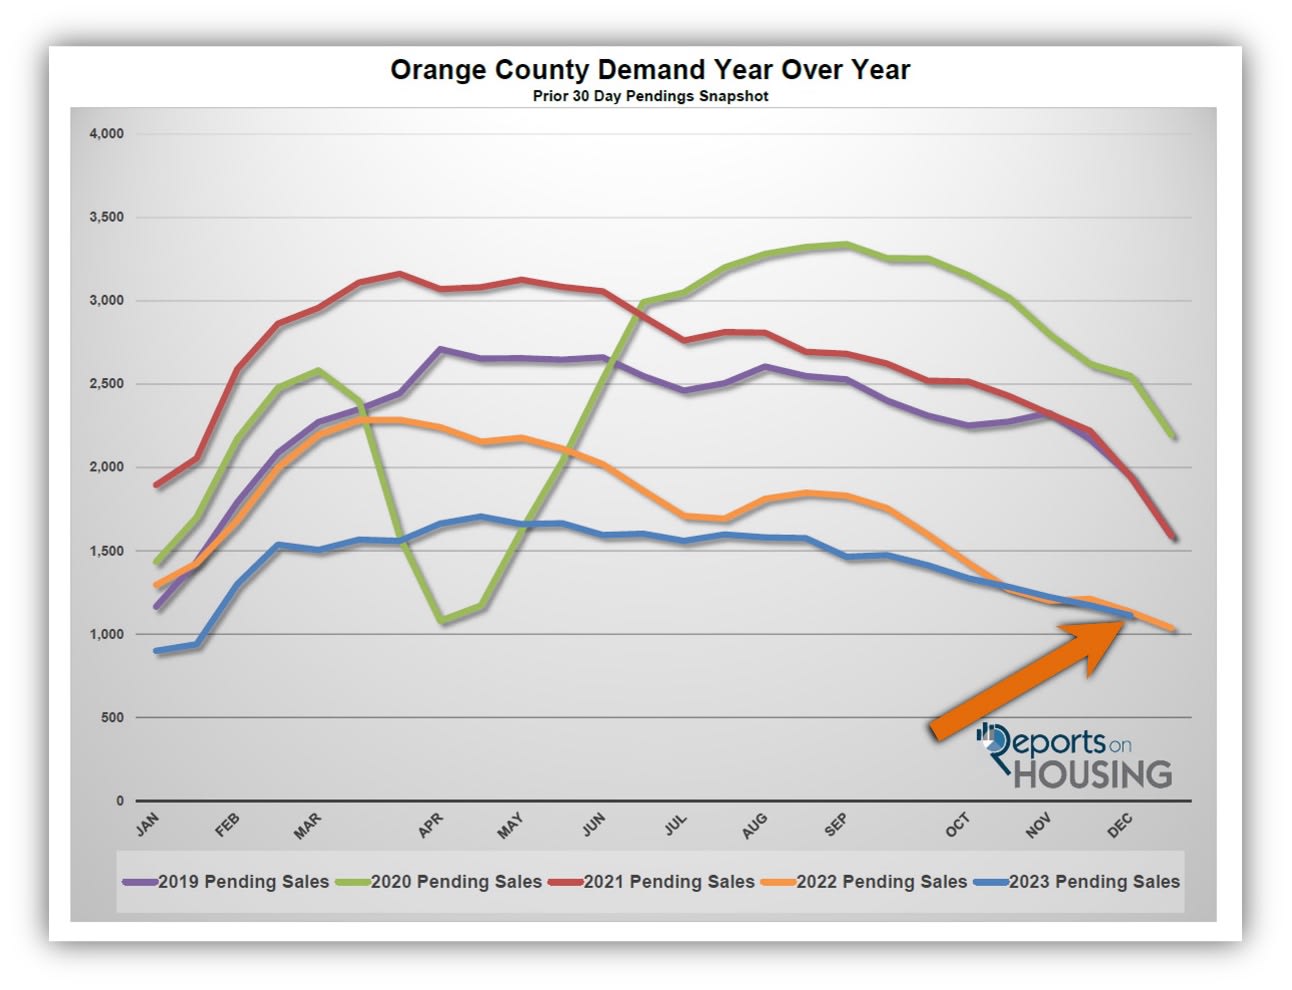
Demand dropped by another 5% in the past couple of weeks.
Demand, a snapshot of the number of new pending sales over the prior month, decreased from 1,173 to 1,113 in the past couple of weeks, down 60 pending sales, or 5%, its lowest December level since tracking began in 2004. Demand is tracking last year’s low anemic levels but is not plunging like it typically does at the end of the year. This is because current demand readings are at inherent levels. There are always buyers willing to purchase in every market, regardless of the time of year. Expect demand to fall to its lowest level upon ringing in 2024. Demand will quickly rise starting in mid-January, the Winter Market.
Last year, demand was at 1,133, 2% higher than today, or an extra 20 pending sales. The 3-year average before COVID (2017 to 2019) was 1,774 pending sales, 59% more than today, or an additional 661.
With supply and demand falling at similar rates, the Expected Market Time (the number of days to sell all Orange County listings at the current buying pace) remained unchanged at 59 days in the past couple of weeks. Last year, the Expected Market Time was 84 days, slower than today. The 3-year average before COVID was 87 days, also slower than today.
The luxury market has not changed much in the past couple of weeks.
In the past couple of weeks, the luxury inventory of homes priced above $2 million decreased from 776 to 745 homes, down 31, or 4%. Luxury demand decreased by nine pending sales, down 6%, and now sits at 133. With demand falling slightly faster than supply, the Expected Market Time for luxury homes priced above $2 million increased from 164 to 168 days, its highest level since January. At 168 days, the luxury market is far from instant and is much slower than the lower ranges. Careful pricing and plenty of patience are the best approaches to today’s luxury market.
Year over year, luxury demand is up by 24 pending sales or 22%, and the active luxury listing inventory is up by 47 homes or 7%. Last year’s Expected Market Time was 192 days, much slower than today.
For homes priced between $2 million and $4 million, the Expected Market Time in the past two weeks increased from 115 to 122 days. For homes priced between $4 million and $6 million, the Expected Market Time decreased from 240 to 213 days. For homes priced above $6 million, the Expected Market Time decreased from 444 to 372 days. At 372 days, a seller would be looking at placing their home into escrow around December 2024.