After bouncing along a record-low number of homeowners willing to sell in the high mortgage rate environment for over a year, there were more new sellers in January compared to 2023, the first “green shoot” since rates soared higher in 2022.
There were 16% more sellers opting to sell in January compared to last year.
Southern California may not have freezing temperatures and snow on the ground like the rest of the country, but it is much cooler. Leaves still fall from the trees, and the golden rolling hills stretch as far as the eyes can see. It is winter. While it may be a time with plenty of sunshine and warmer temperatures when the wind shifts, it is also the rainy season. This year’s El Niño climate pattern has delivered a lot of rain and promises to deliver even more in the coming weeks. In no time, the rolling golden hills will magically turn green. If you look closely, there are already plenty of green shoots.
According to Investopedia.com, "green shoots" is a term used to describe signs of economic recovery or positive data during an economic downturn. They are a welcome symbol that the economy is on the mend and slowly trending upward. In this case, the housing market has been in a funk since mortgage rates rocketed from 3.25% at the start of 2022 to eclipsing 8% last October. Pending sales and closed sales plunged. Last year’s closed sales were one of the lowest totals in decades. Homeowners have opted to stay put in their homes, unwilling to sell and give up their incredible, low fixed-rate mortgages. Since tracking began, the number of sellers coming on the market has plummeted to its lowest level. Each of these data lines reached a low in 2023 and established a bottom. This bottom gave way to the first sign of recovery: green shoots in the number of homes coming on the market, homeowners willing to sell.
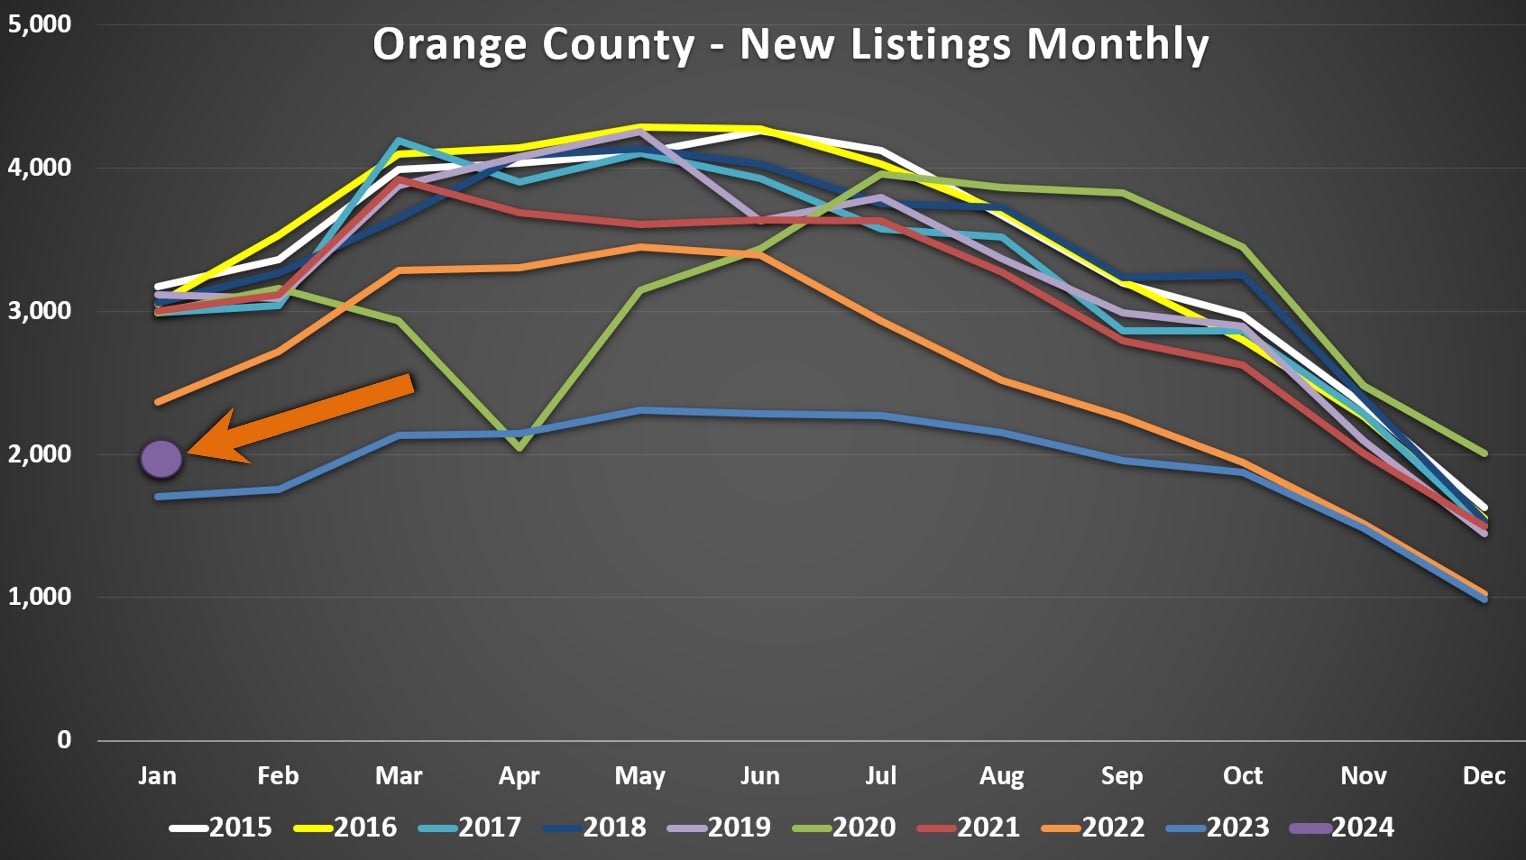
You cannot purchase what is not for sale. The limited number of homes coming on the market has exacerbated an already limited number of homes available to buy, which limits the number of pending and closed sales. Higher rates have significantly impacted demand, but so have the lack of sellers. Sales can only increase when more homeowners are willing to participate and sell their homes. In January, more homes were placed on the market than the prior year for the first time since June 2021.
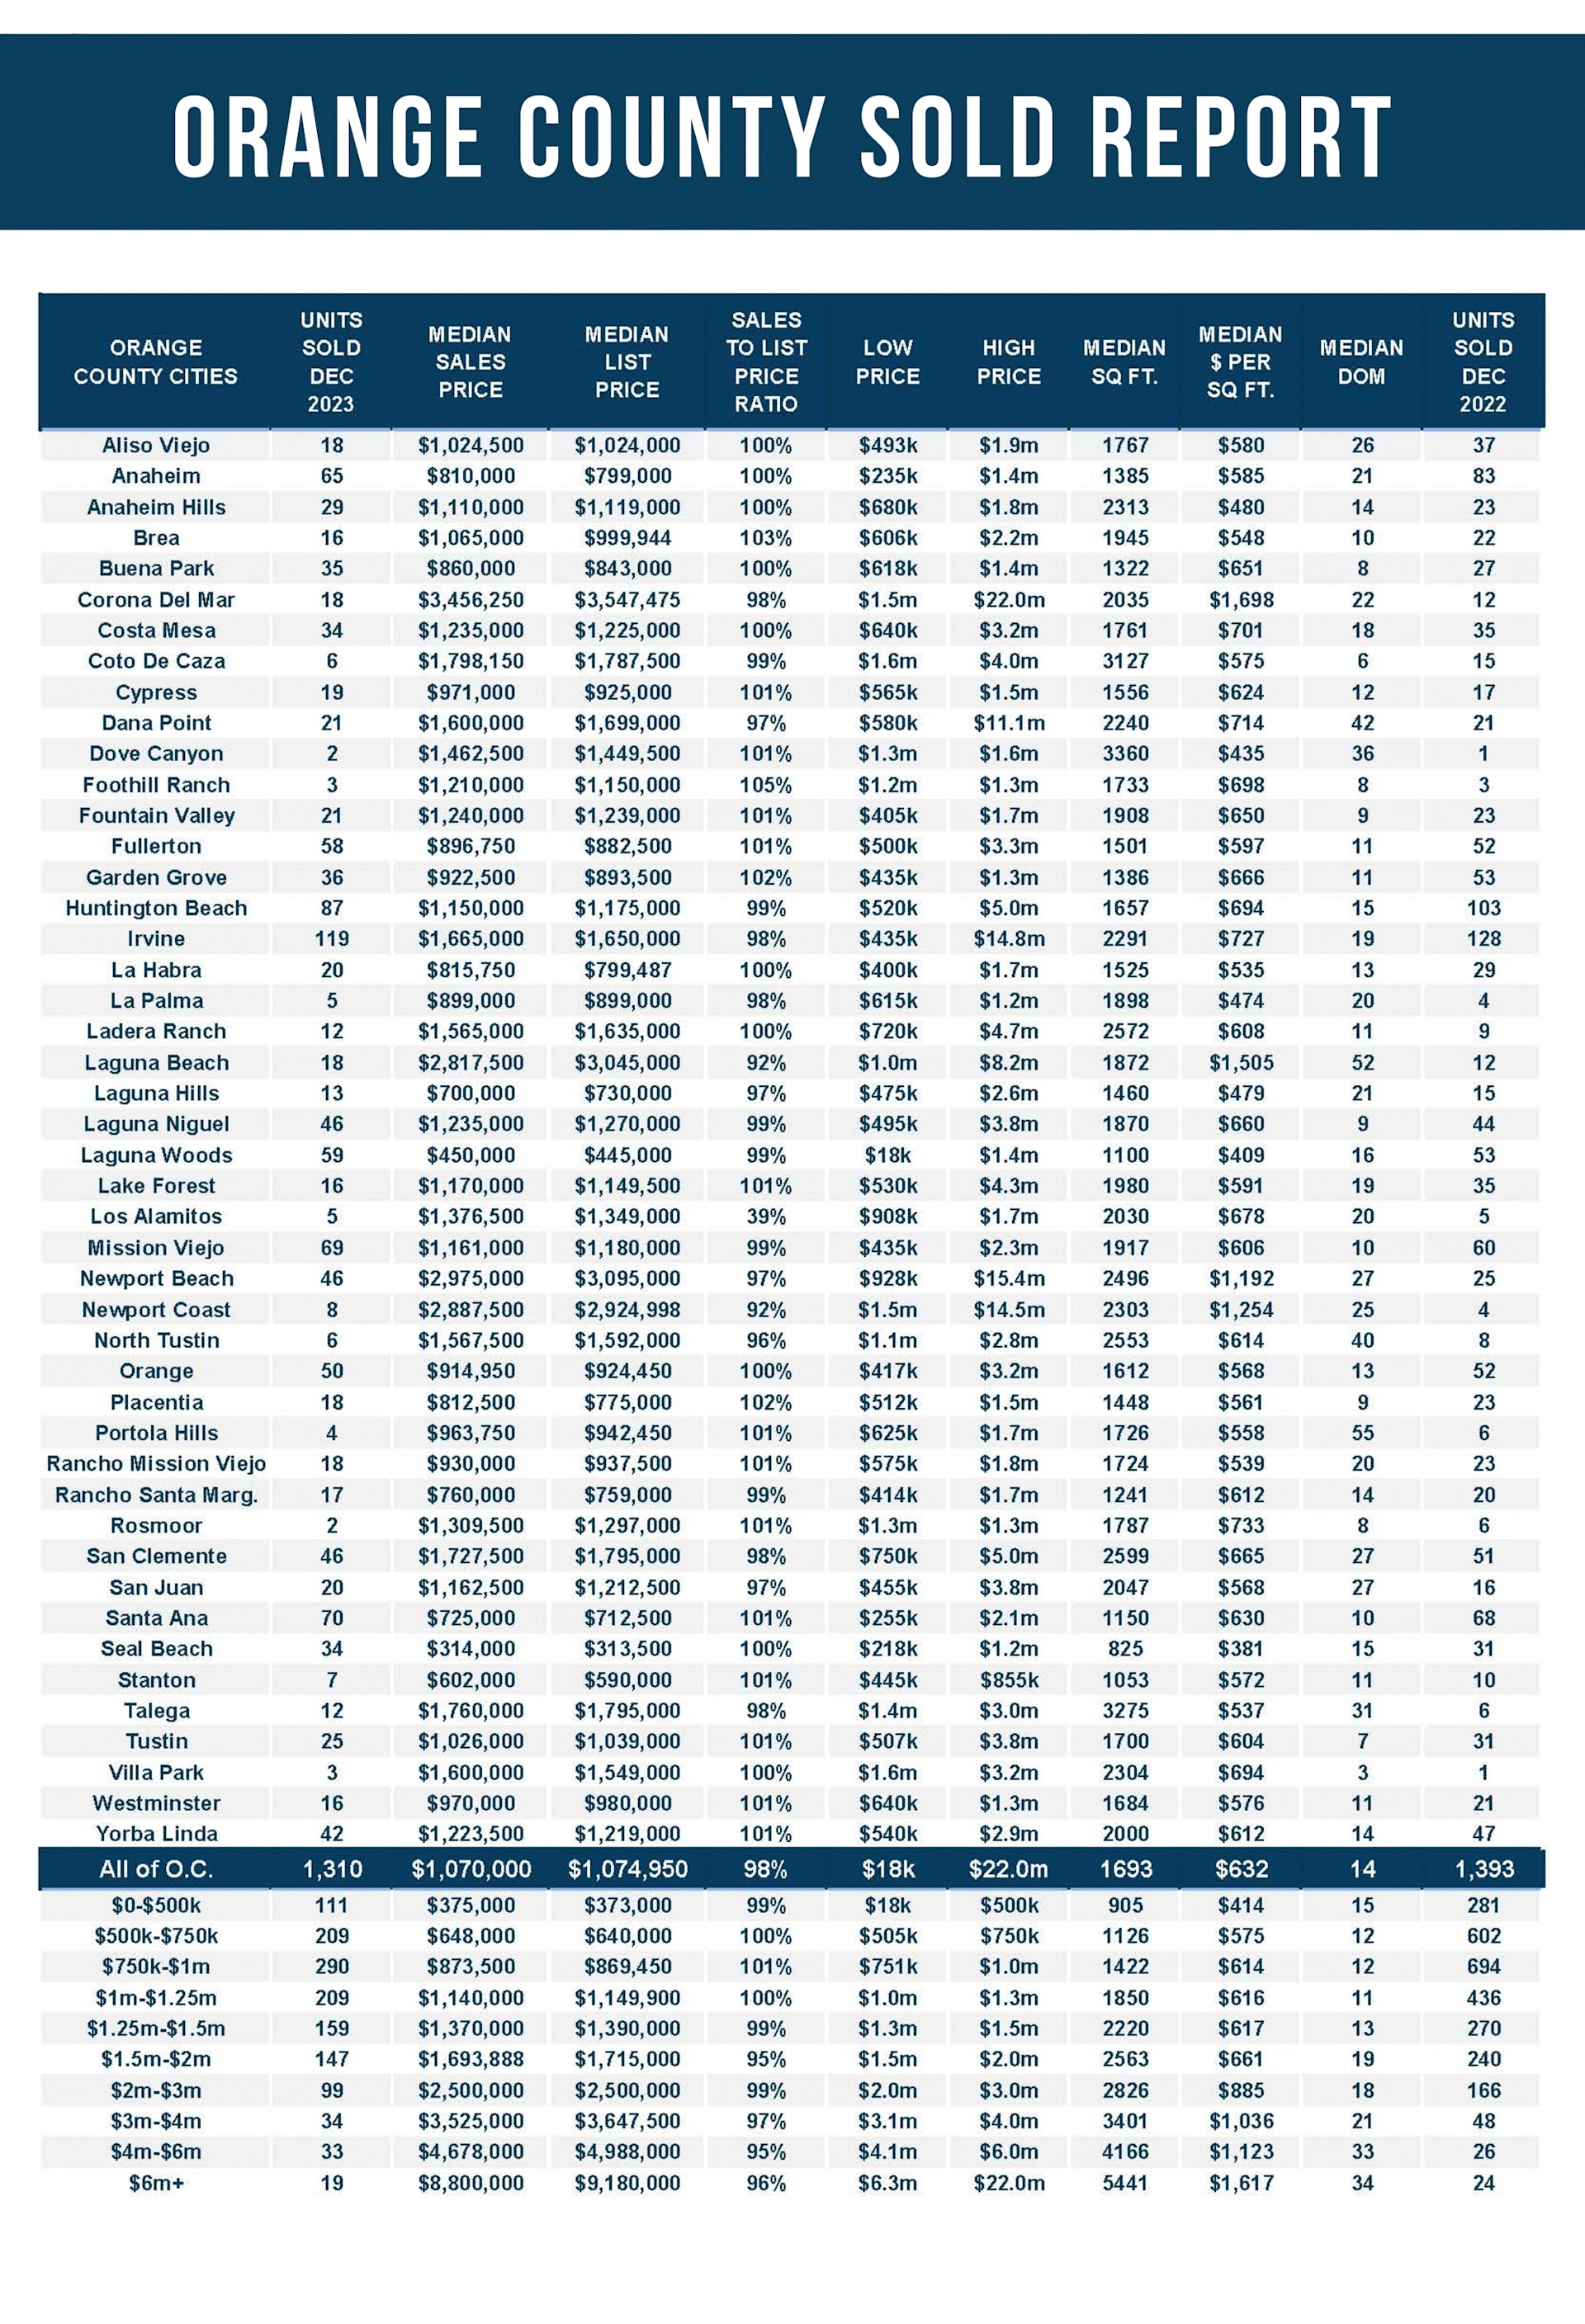
There were 1,982 new FOR-SALE signs in January, up 16% compared to January 2023’s 1,705 or an extra 277 sellers. It is still far below the 3-year average before COVID (2017 to 2019), 3,054 new sellers, when housing was normal. January’s reading was 35% below that average or 1,072 fewer signs. Nonetheless, it is a green shoot. More homeowners are opting to sell despite their lower fixed-rate mortgages. This is just the start, but it establishes a new trend: more available homes coming on the market for buyers to choose from.
The trend began to unfold in October when year-over-year differences were only slightly less. Yet, the difference in January is substantial and not a fluke. It is a paradigm shift in homeowners’ thinking. Many are tired of waiting for rates to come down. They have reasons for wanting to move: increased family size, empty nesters, job opportunities elsewhere, moving closer to family, etcetera. Over time, more and more homeowners desired to sell when the timing was right. There was pent-up seller demand that accumulated over the past couple of years. Eventually, something had to give.
Still, until mortgage rates fall further, the number of homes coming on the market will remain muted. Many homeowners continue to “hunker down” in their homes, unwilling to move due to their current underlying, locked-in, low fixed-rate mortgage. Through the third quarter of 2023, according to the Federal Housing Finance Agency’s National Mortgage Database, 85% of all Californians with a mortgage have a mortgage rate at or below 5%. More than two-thirds, 69%, have a rate at or below 4%. And an astonishing 30% are at or below 3%. In 2023, there were 41% fewer sellers than the 3-year average before COVID (2017 to 2019), with 16,920 missing FOR-SALE signs.
The January reading is a green shoot. There are more sellers, which eventually means more pending and closed sales. With mortgage rates anticipated to fall further this year, the lower rates dive, the more homeowners are willing to participate. When rates eventually fall below 6%, the increase will be substantial and more than matched by a considerable rise in demand as affordability improves. This is the year of green shoots in housing when the behemoth housing market wakes from its nearly two-year slumber.
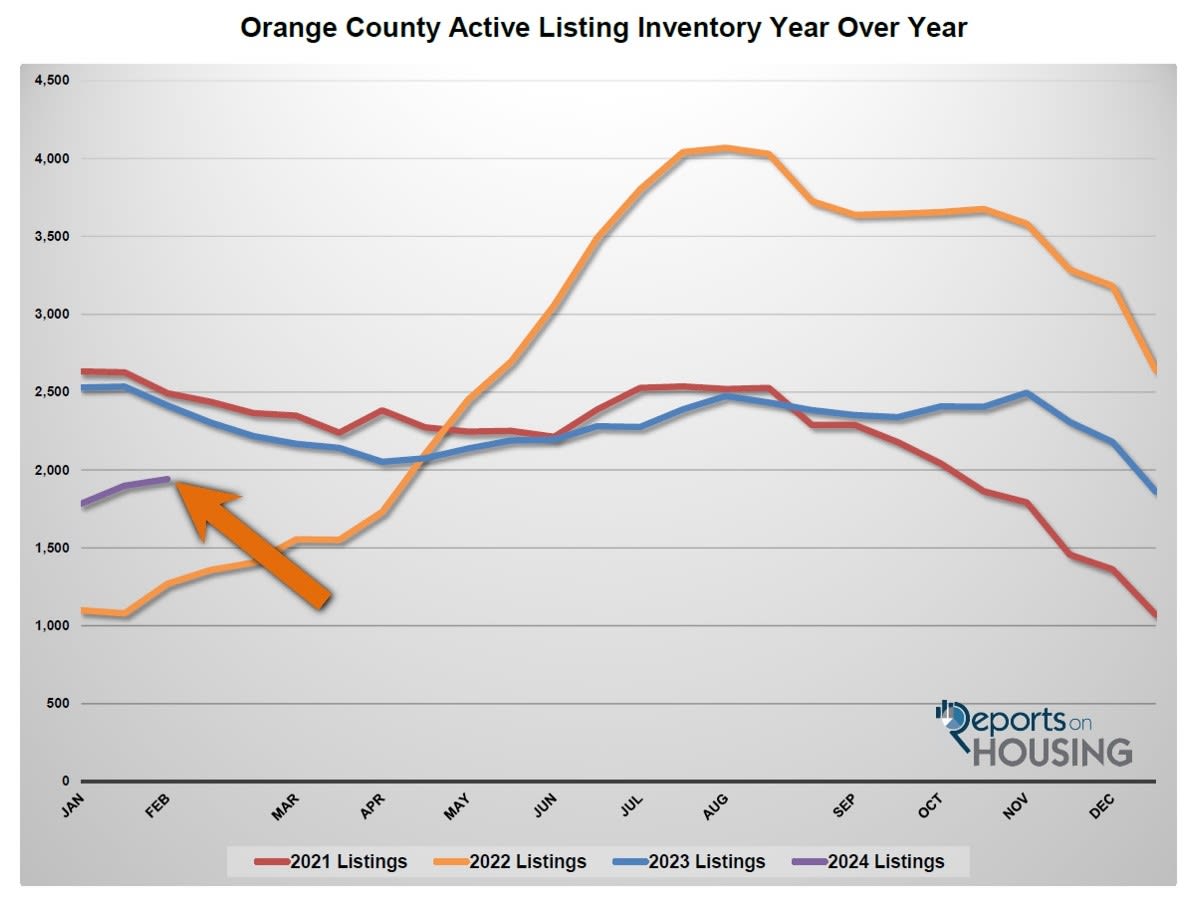
The active inventory increased by 2% in the past couple of weeks.
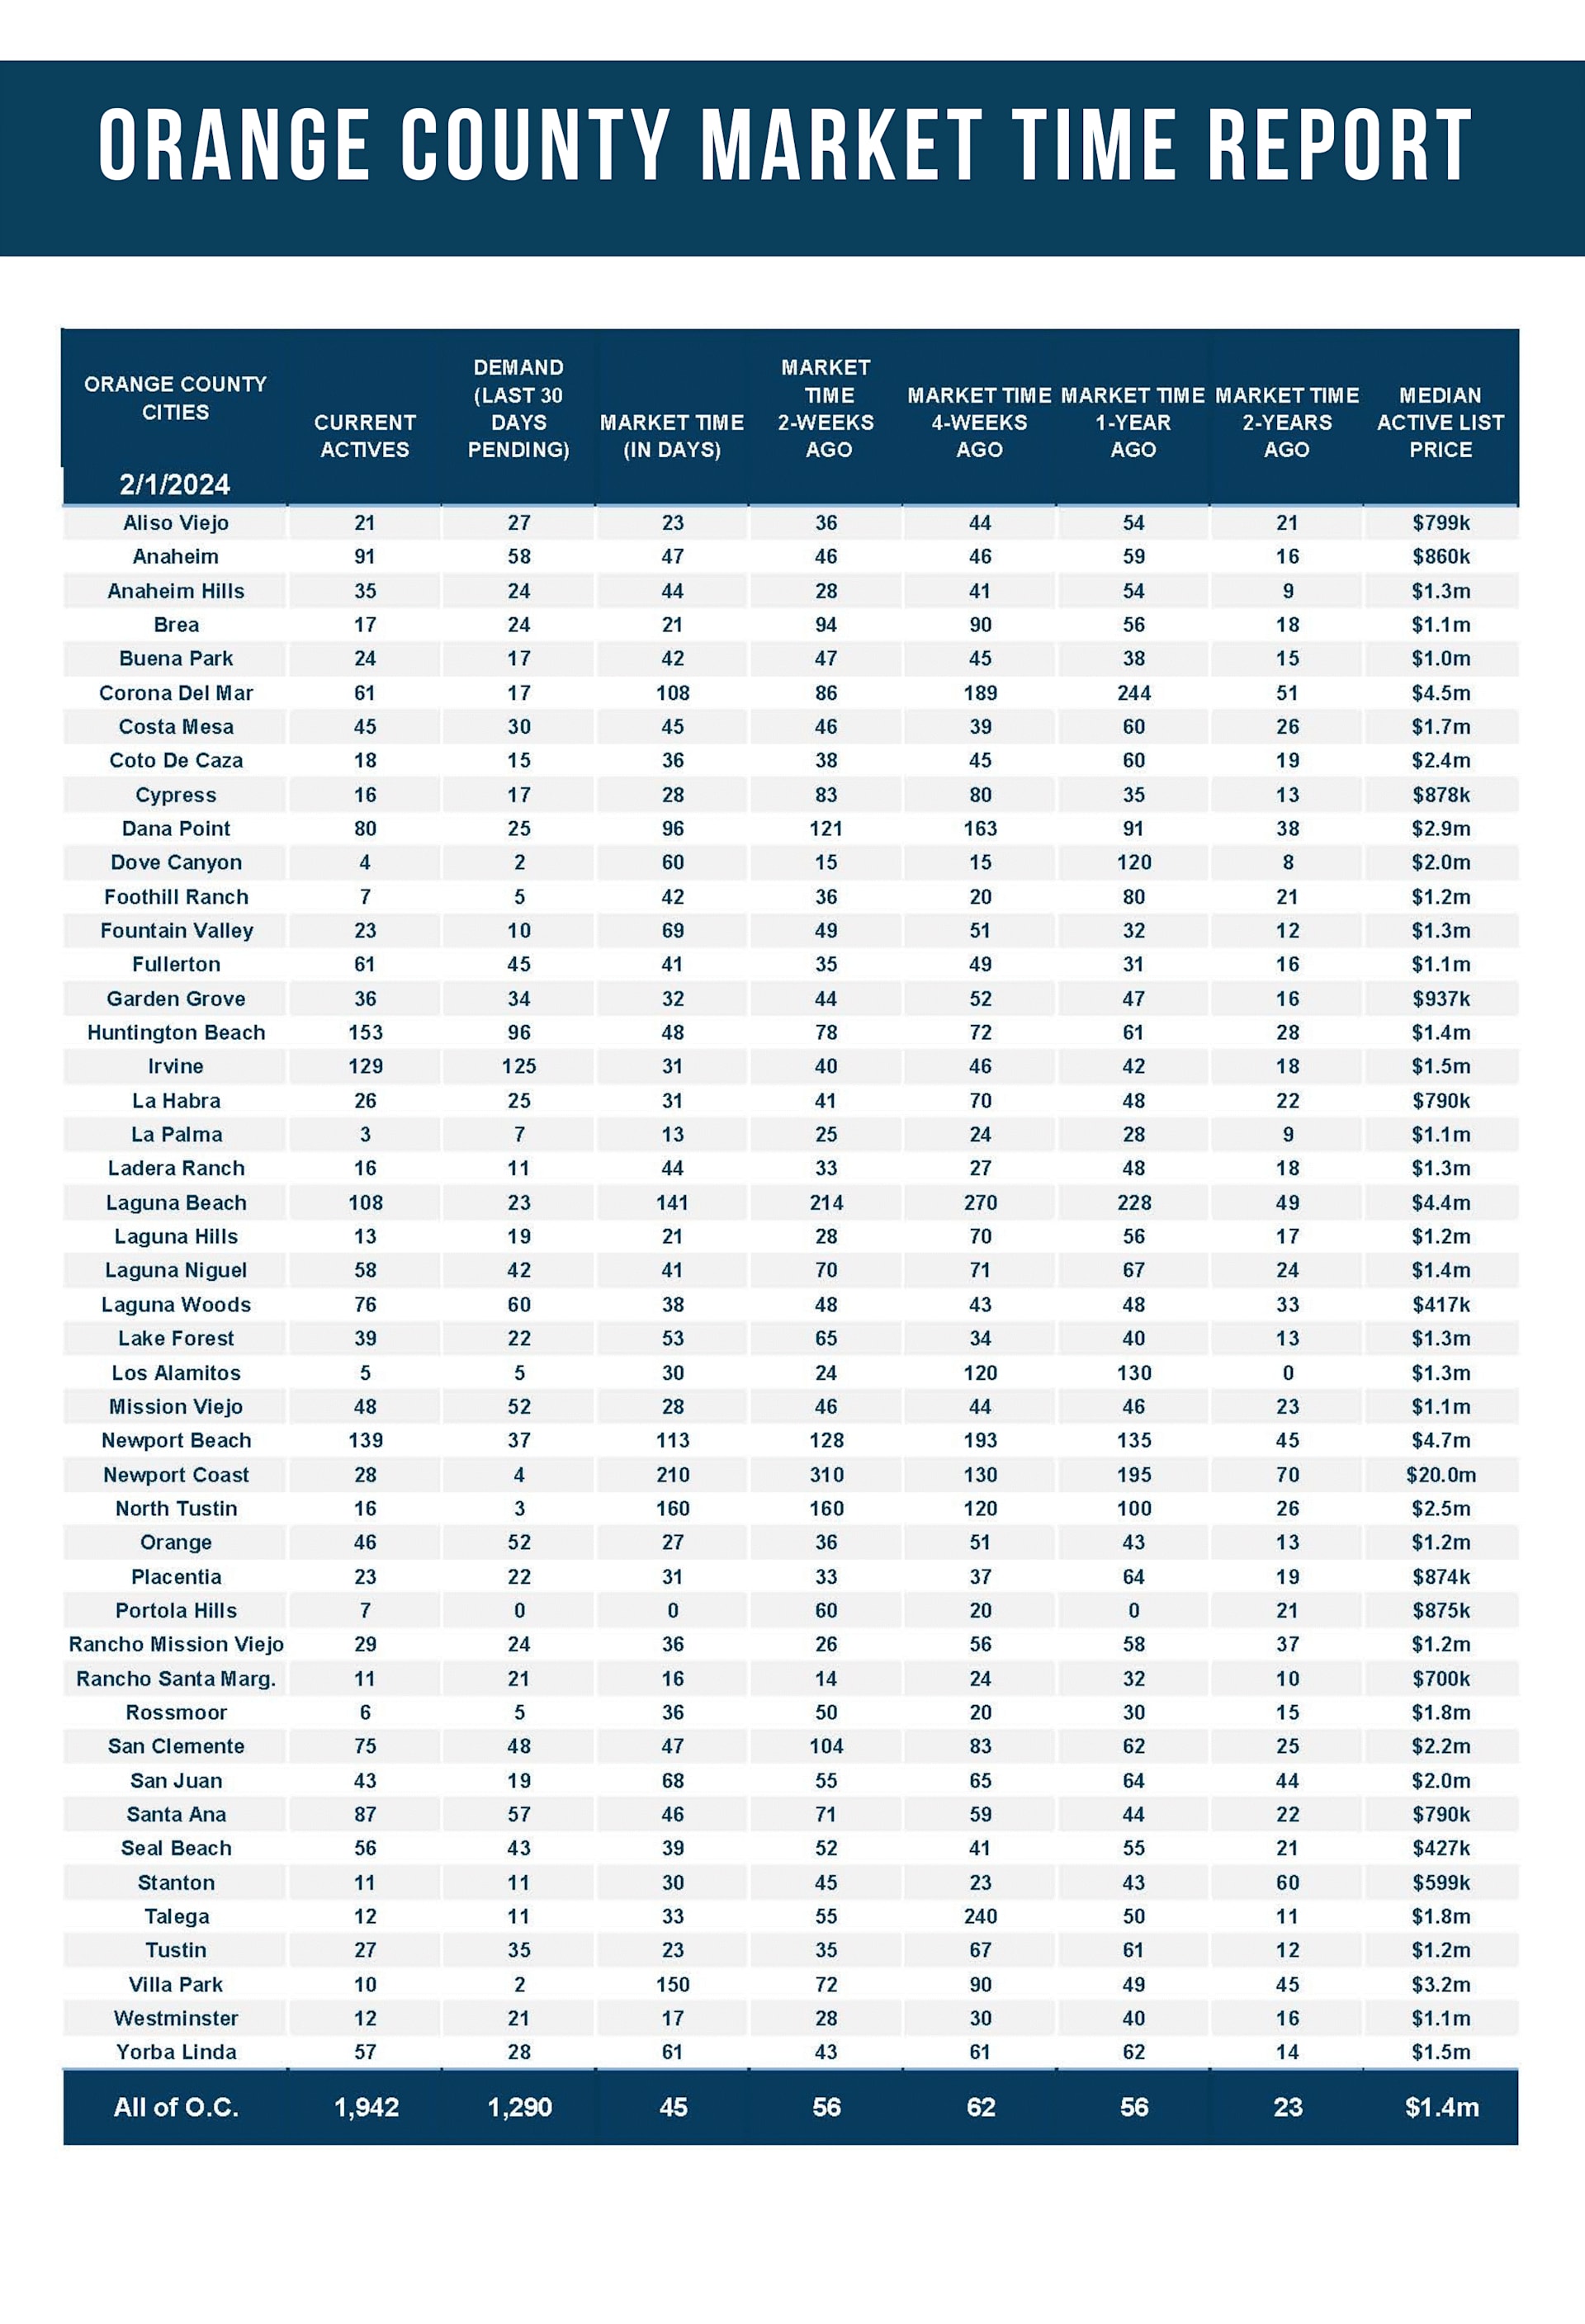
The active listing inventory increased by 42 homes in the past two weeks, up 2%, and now sits at 1,942. That is a deficient level compared to pre-COVID years. The 3-year average before the pandemic (2017 to 2019) was 4,843, an extra 2,901 or 149%, more than double. It is hard to put into perspective just how low the inventory has been for the past several years. Yet, for buyers looking to purchase, it means that there are not that many choices. Another “green shoot” is that the inventory level is not dropping like it did last year and in 2021 but has been on the rise. With more homes coming on the market, it is finally paving the way to a typical cyclical increase in the inventory that picks up steam in the spring and peaks during the summer. It is too early to tell if the rising inventory trend will continue, but it is a healthy initial sign for 2024.
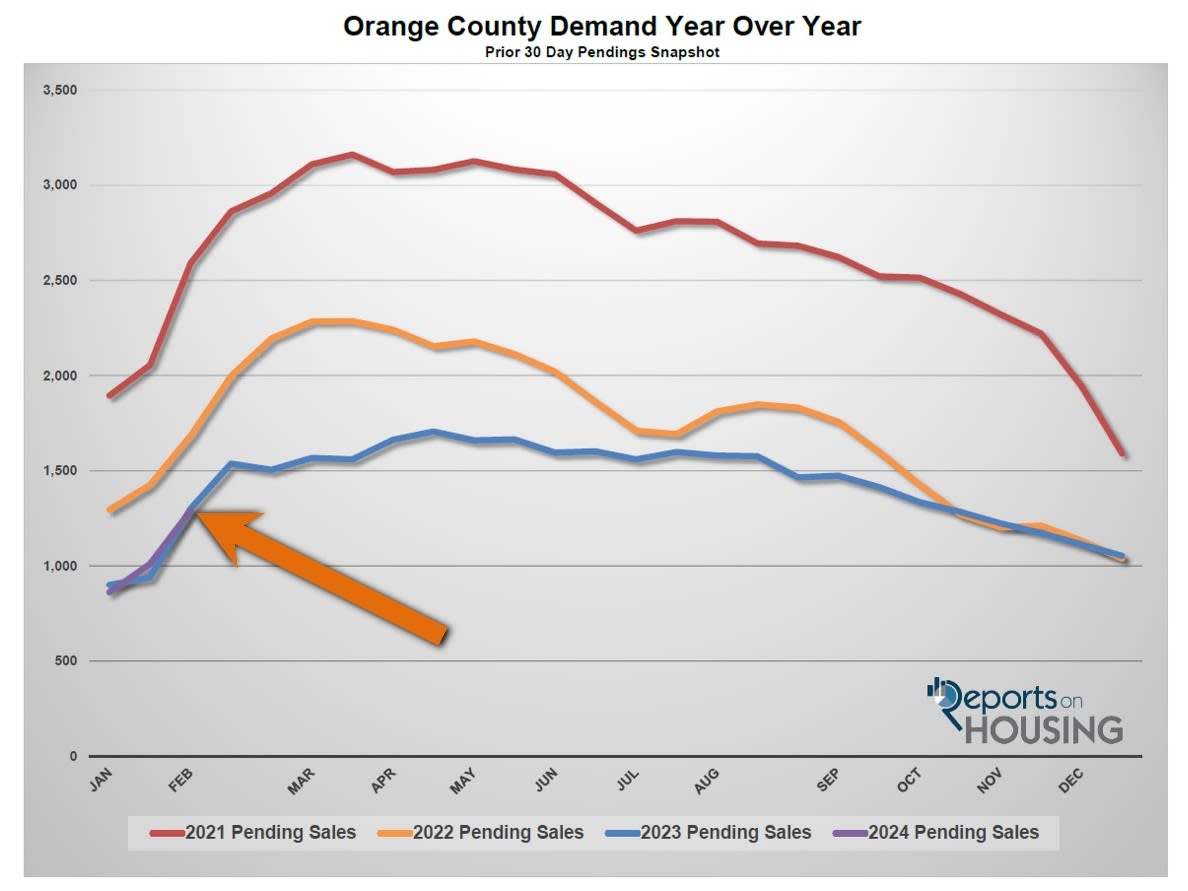
Demand jumped by 28% in the past couple of weeks.
Demand, a snapshot of the number of new pending sales over the prior month, shot up from 1,010 to 1,290 in the past couple of weeks, up 280 pending sales, or 28%, its largest increase since last February. It is still the lowest initial February reading since tracking began 20 years ago, almost identical to last year’s 1,300 pending sales reading. Demand should start to outpace last year’s level, with more homes finally coming on the market, paving the way for another “green shoot” in 2024. The year is young, and El Niño may delay the rise, but it is bound to occur. Especially when rates materially fall from their current levels due to a weakening economy later this year. The U.S. economy has been extraordinarily resilient but will eventually cool from its rapid pace because of various headwinds.
Last year, demand was 1,300, 1% more than today, or ten extra pending sales. The 3-year average before COVID (2017 to 2019) was 2,160 pending sales, 67% more than today, or an additional 870.
With demand soaring compared to the small rise in supply, the Expected Market Time (the number of days to sell all Orange County listings at the current buying pace) plunged from 56 to 45 days in the past couple of weeks, indicating a very hot housing market where negotiations have quickly lined up in the seller’s favor. Last year, the Expected Market Time was 56 days, slower than today. The 3-year average before COVID was 70 days, also slower than today.
The luxury market improved dramatically in the past couple of weeks.
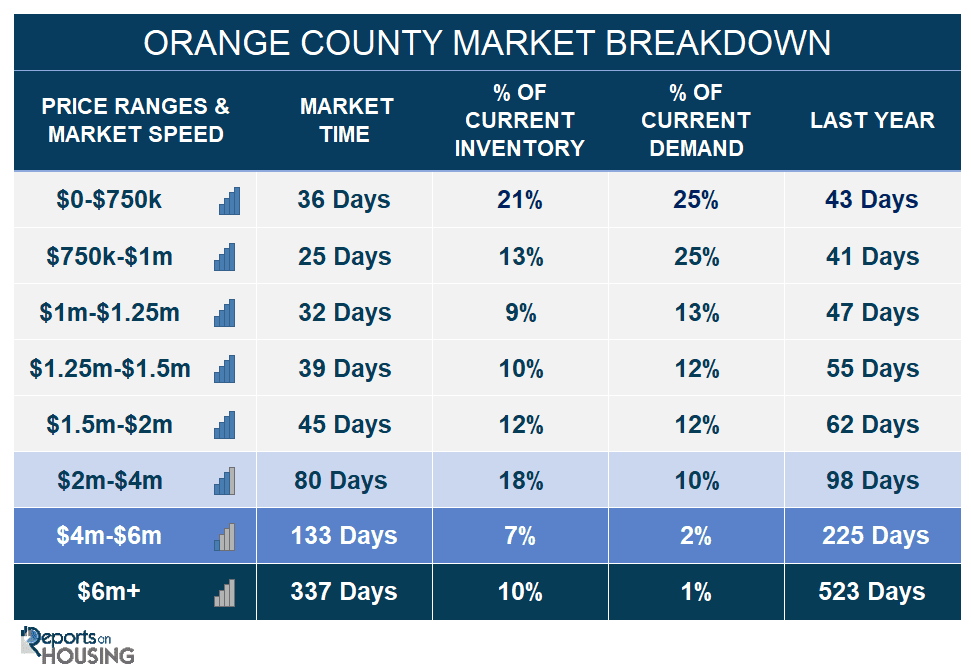
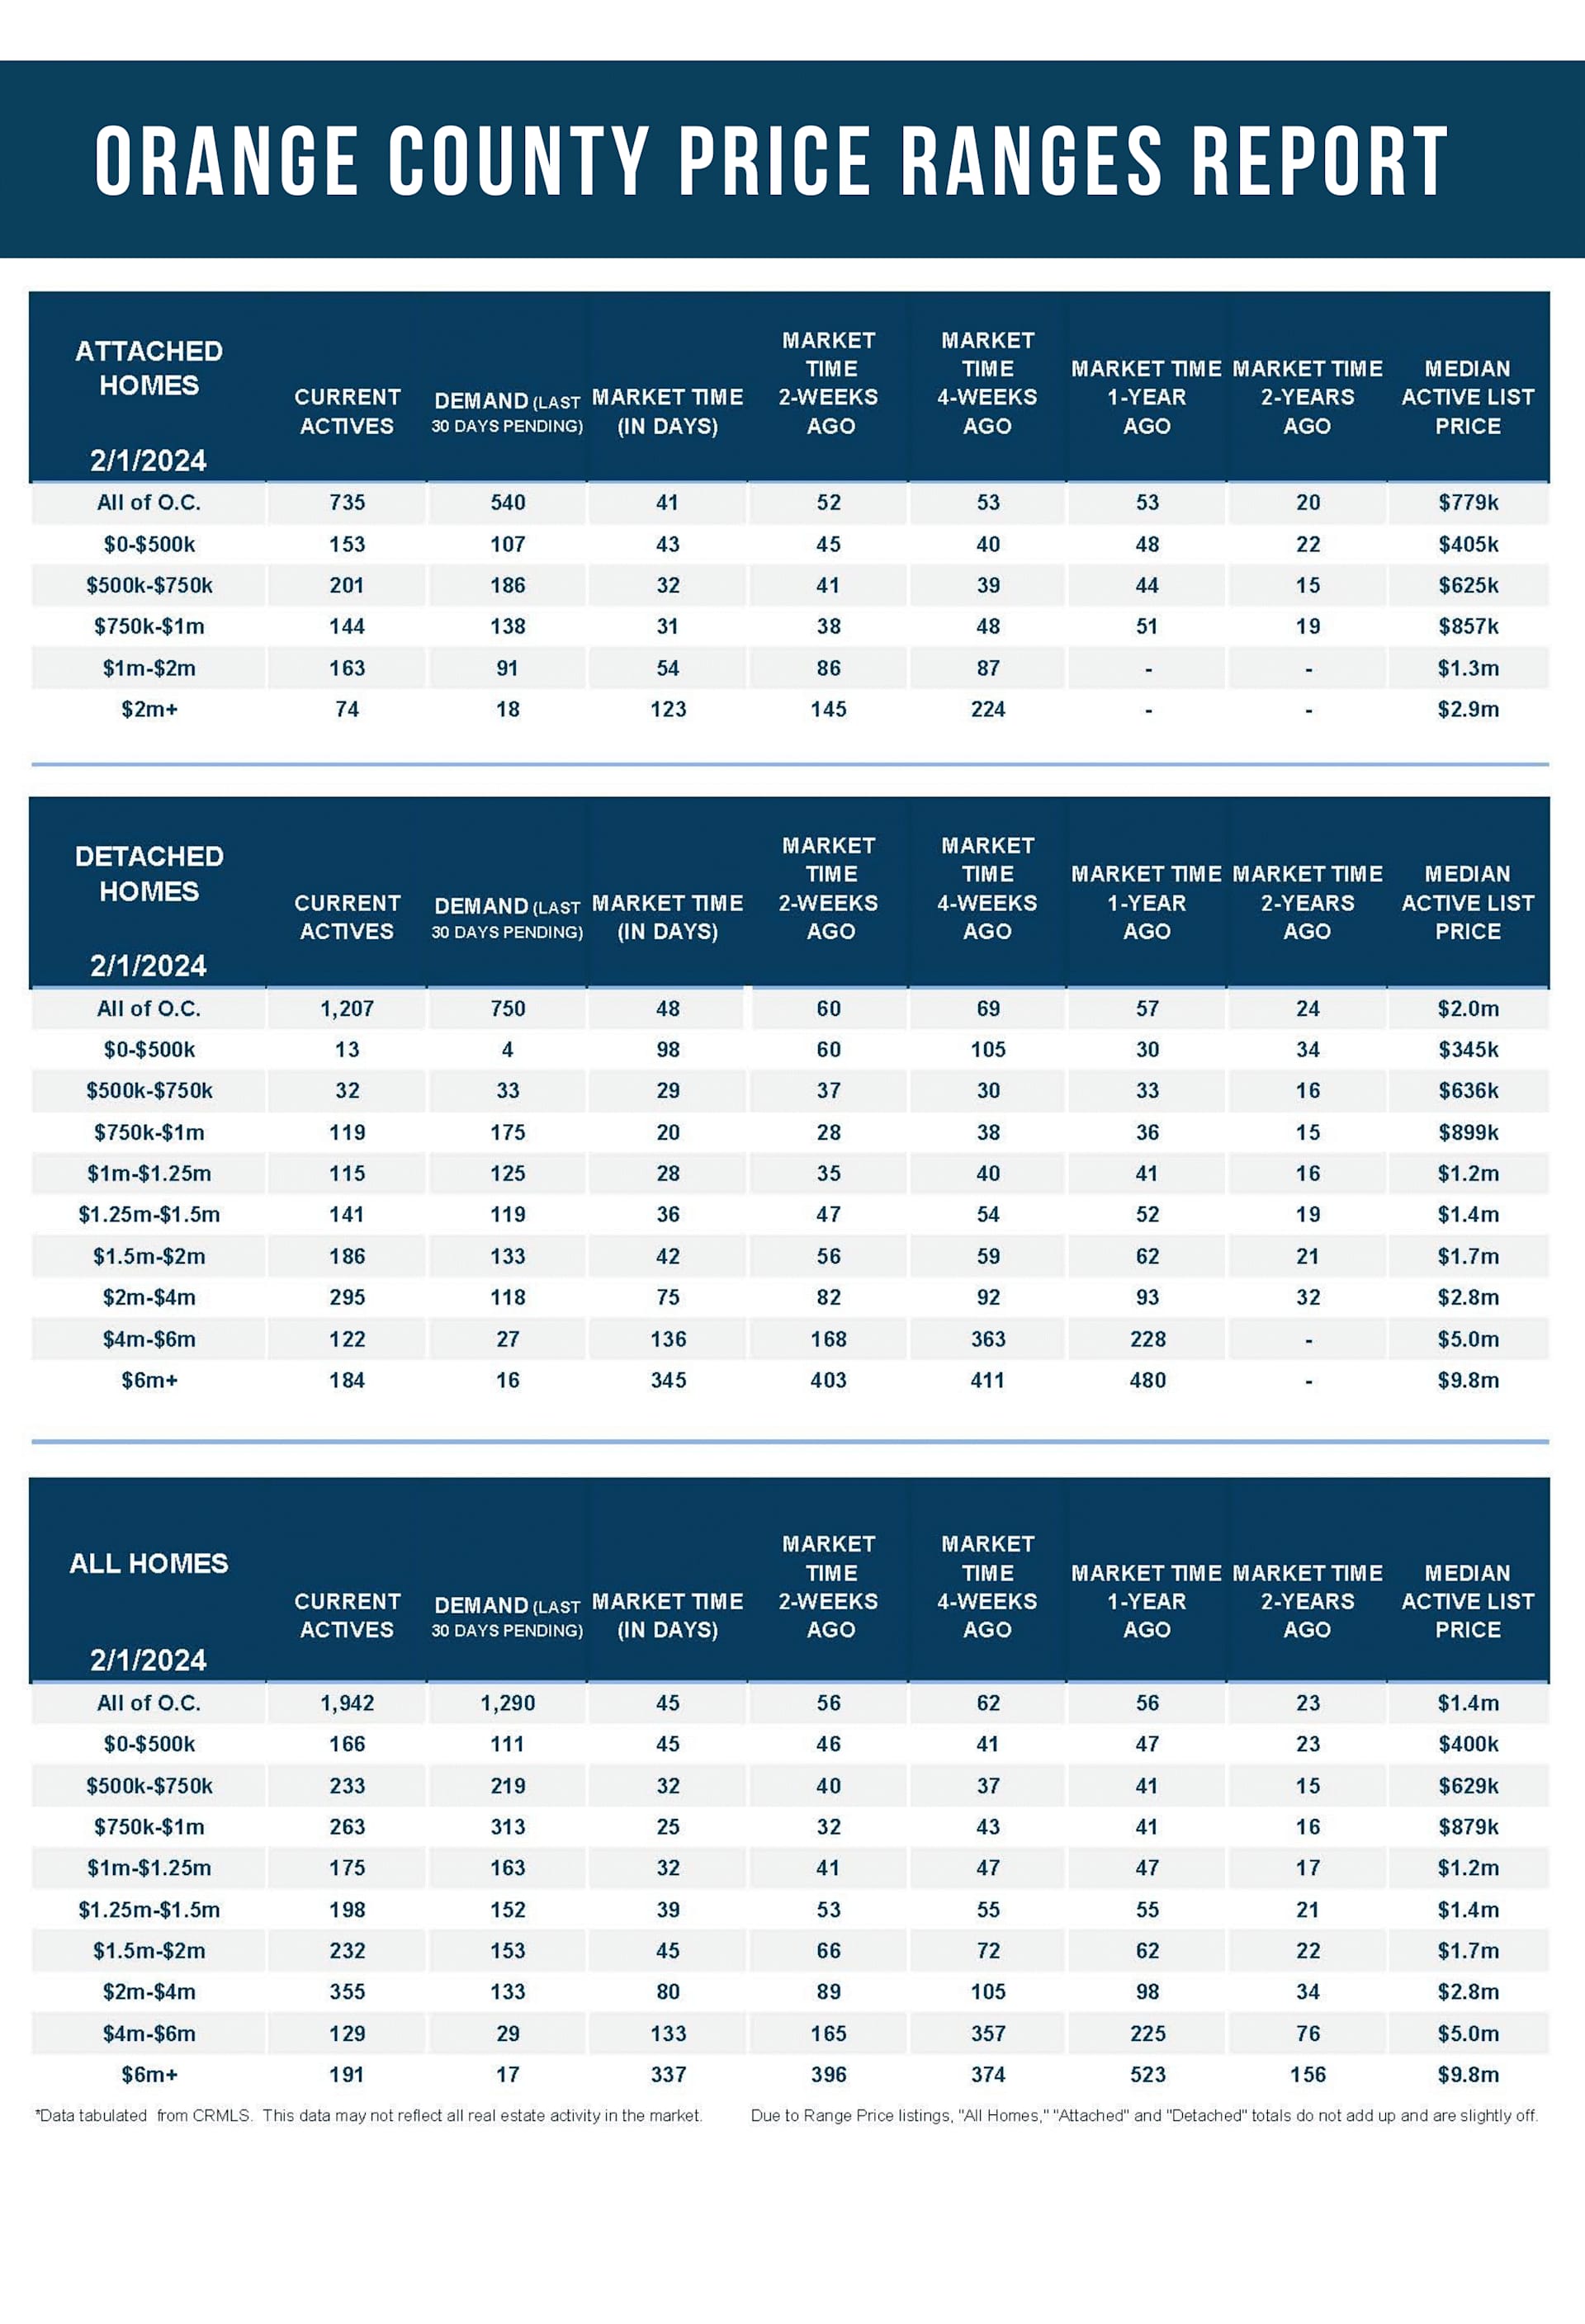
In the past couple of weeks, the luxury inventory of homes priced above $2 million increased from 659 to 675 homes, up 16, or 2%. Luxury demand grew by 27 pending sales, up 18%, and now sits at 179, its highest level since October. With demand surging higher compared to the smaller rise in supply, the Expected Market Time for luxury homes priced above $2 million plunged from 130 to 113 days, its lowest reading since the start of August. For perspective, the lower ranges (less than $2 million) have an Expected Market Time of 34 days. While 113 days is not instant, it is substantially better than the 168-day level reached at the start of December. The best approach to today’s luxury market remains careful pricing and plenty of patience.
Year over year, luxury demand is up by 55 pending sales or 44%, and the active luxury listing inventory is up by 83 homes or 14%. Last year’s Expected Market Time was 143 days, slower than today.
For homes priced between $2 million and $4 million, the Expected Market Time in the past two weeks decreased from 89 to 80 days. For homes priced between $4 million and $6 million, the Expected Market Time decreased from 165 to 133 days. For homes priced above $6 million, the Expected Market Time decreased from 396 to 337 days. At 337 days, a seller would be looking at placing their home into escrow around January 2025.