February 20, 2024
Mortgage rates have crept their way back above 7% with hotter than expected economic readings, resulting in a slowdown in purchase activity.
The 7% mortgage rate is a psychological barrier to the housing market.
Airline travel is particularly sensitive to airfare pricing. There are so many online choices to compare fares easily. Travelers quickly jump for more affordable options, even if it means changing traveling dates, accepting layovers, or flying on a red-eye. When airfares spike, many travelers alter or scrap their travel plans altogether. Yet, if fares unexpectedly drop, demand soars, and flights are booked seemingly overnight. The price sensitivity of airline consumers makes it tricky for airlines to fill planes and still earn a profit.
Similarly, prospective buyers are very sensitive to how much their monthly payment will be, which is determined by the prevailing mortgage rate. Home values skyrocketed higher as mortgage rates plunged to record lows from 2020 through the first few months of 2022. That changed as mortgage rates soared from 3.25% at the start of 2022 to 7.37% by October. In 2023, rates climbed from 5.99% in February to 8% in October. They remained above 7% from the end of July 2023 through mid-December. Despite a limited supply, values do not change much when rates climb above 7%. The combination of elevated home prices and the high mortgage rate environment has resulted in an exceptionally rate-sensitive housing market.
The Federal Reserve set out on a course to bring down inflation, which had spiked to 9% by June 2022. Inflation has been an international problem linked to disruptions in the global supply chain and considerable shifts in demand due to the COVID-19 pandemic. The Consumer Price Index has dropped to 3.1% but has a ways to go to hit the Federal Reserve’s 2% target. The Federal Reserve has indicated that they will most likely drop the short-term Federal Funds Rate three times this year. Still, they are very data dependent, meaning they watch every U.S. economic data point, from the number of job openings to consumption to many monthly inflation indicators.
In December, right after indicating that they would be cutting rates in 2024, rates plunged from 7.09% to 6.62%, its lowest rate in seven months. Since then, a series of economic reports suggest that the economy has not entirely cooled enough for the Fed to start its cuts. Many anticipated the cuts to begin as early as March, but now it looks more like June. This change resulted in rates climbing to 7.1%, according to Mortgage News Daily.
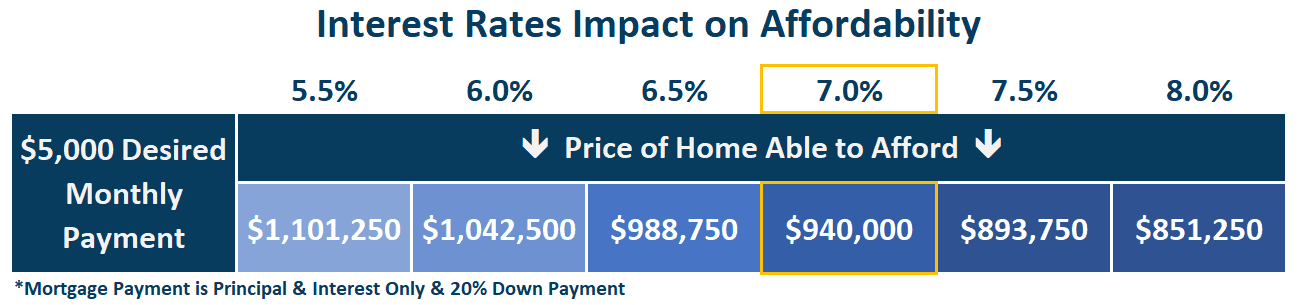
The change in rates has cut into home affordability. On February 1st, mortgage rates dropped to nearly 6.5%. Buyers desirous of a $5,000 per month principal and interest payment with 20% down, at 6.5%, would be looking at a $988,750 home. As mortgage rates migrated back up to 7%, those same buyers are now looking at a $940,000 home, nearly $50,000 less of a home.
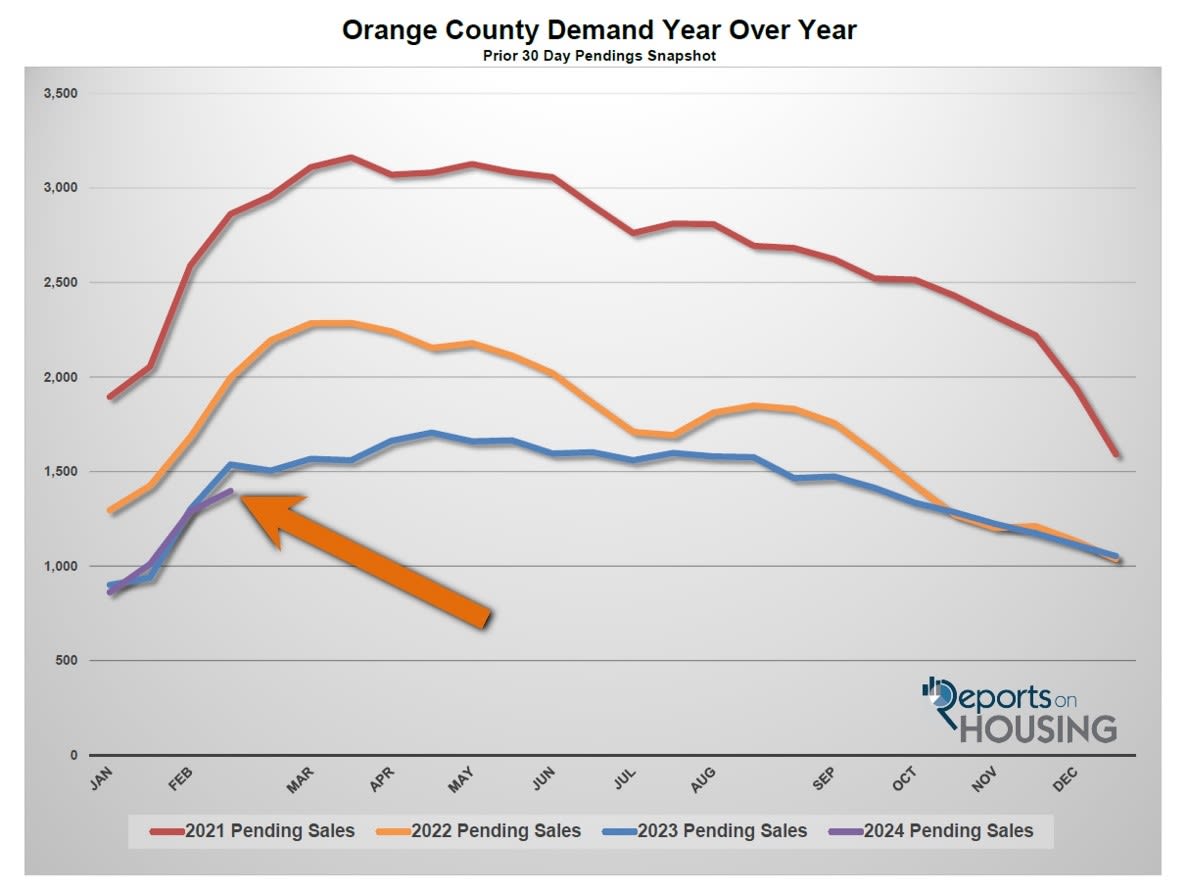
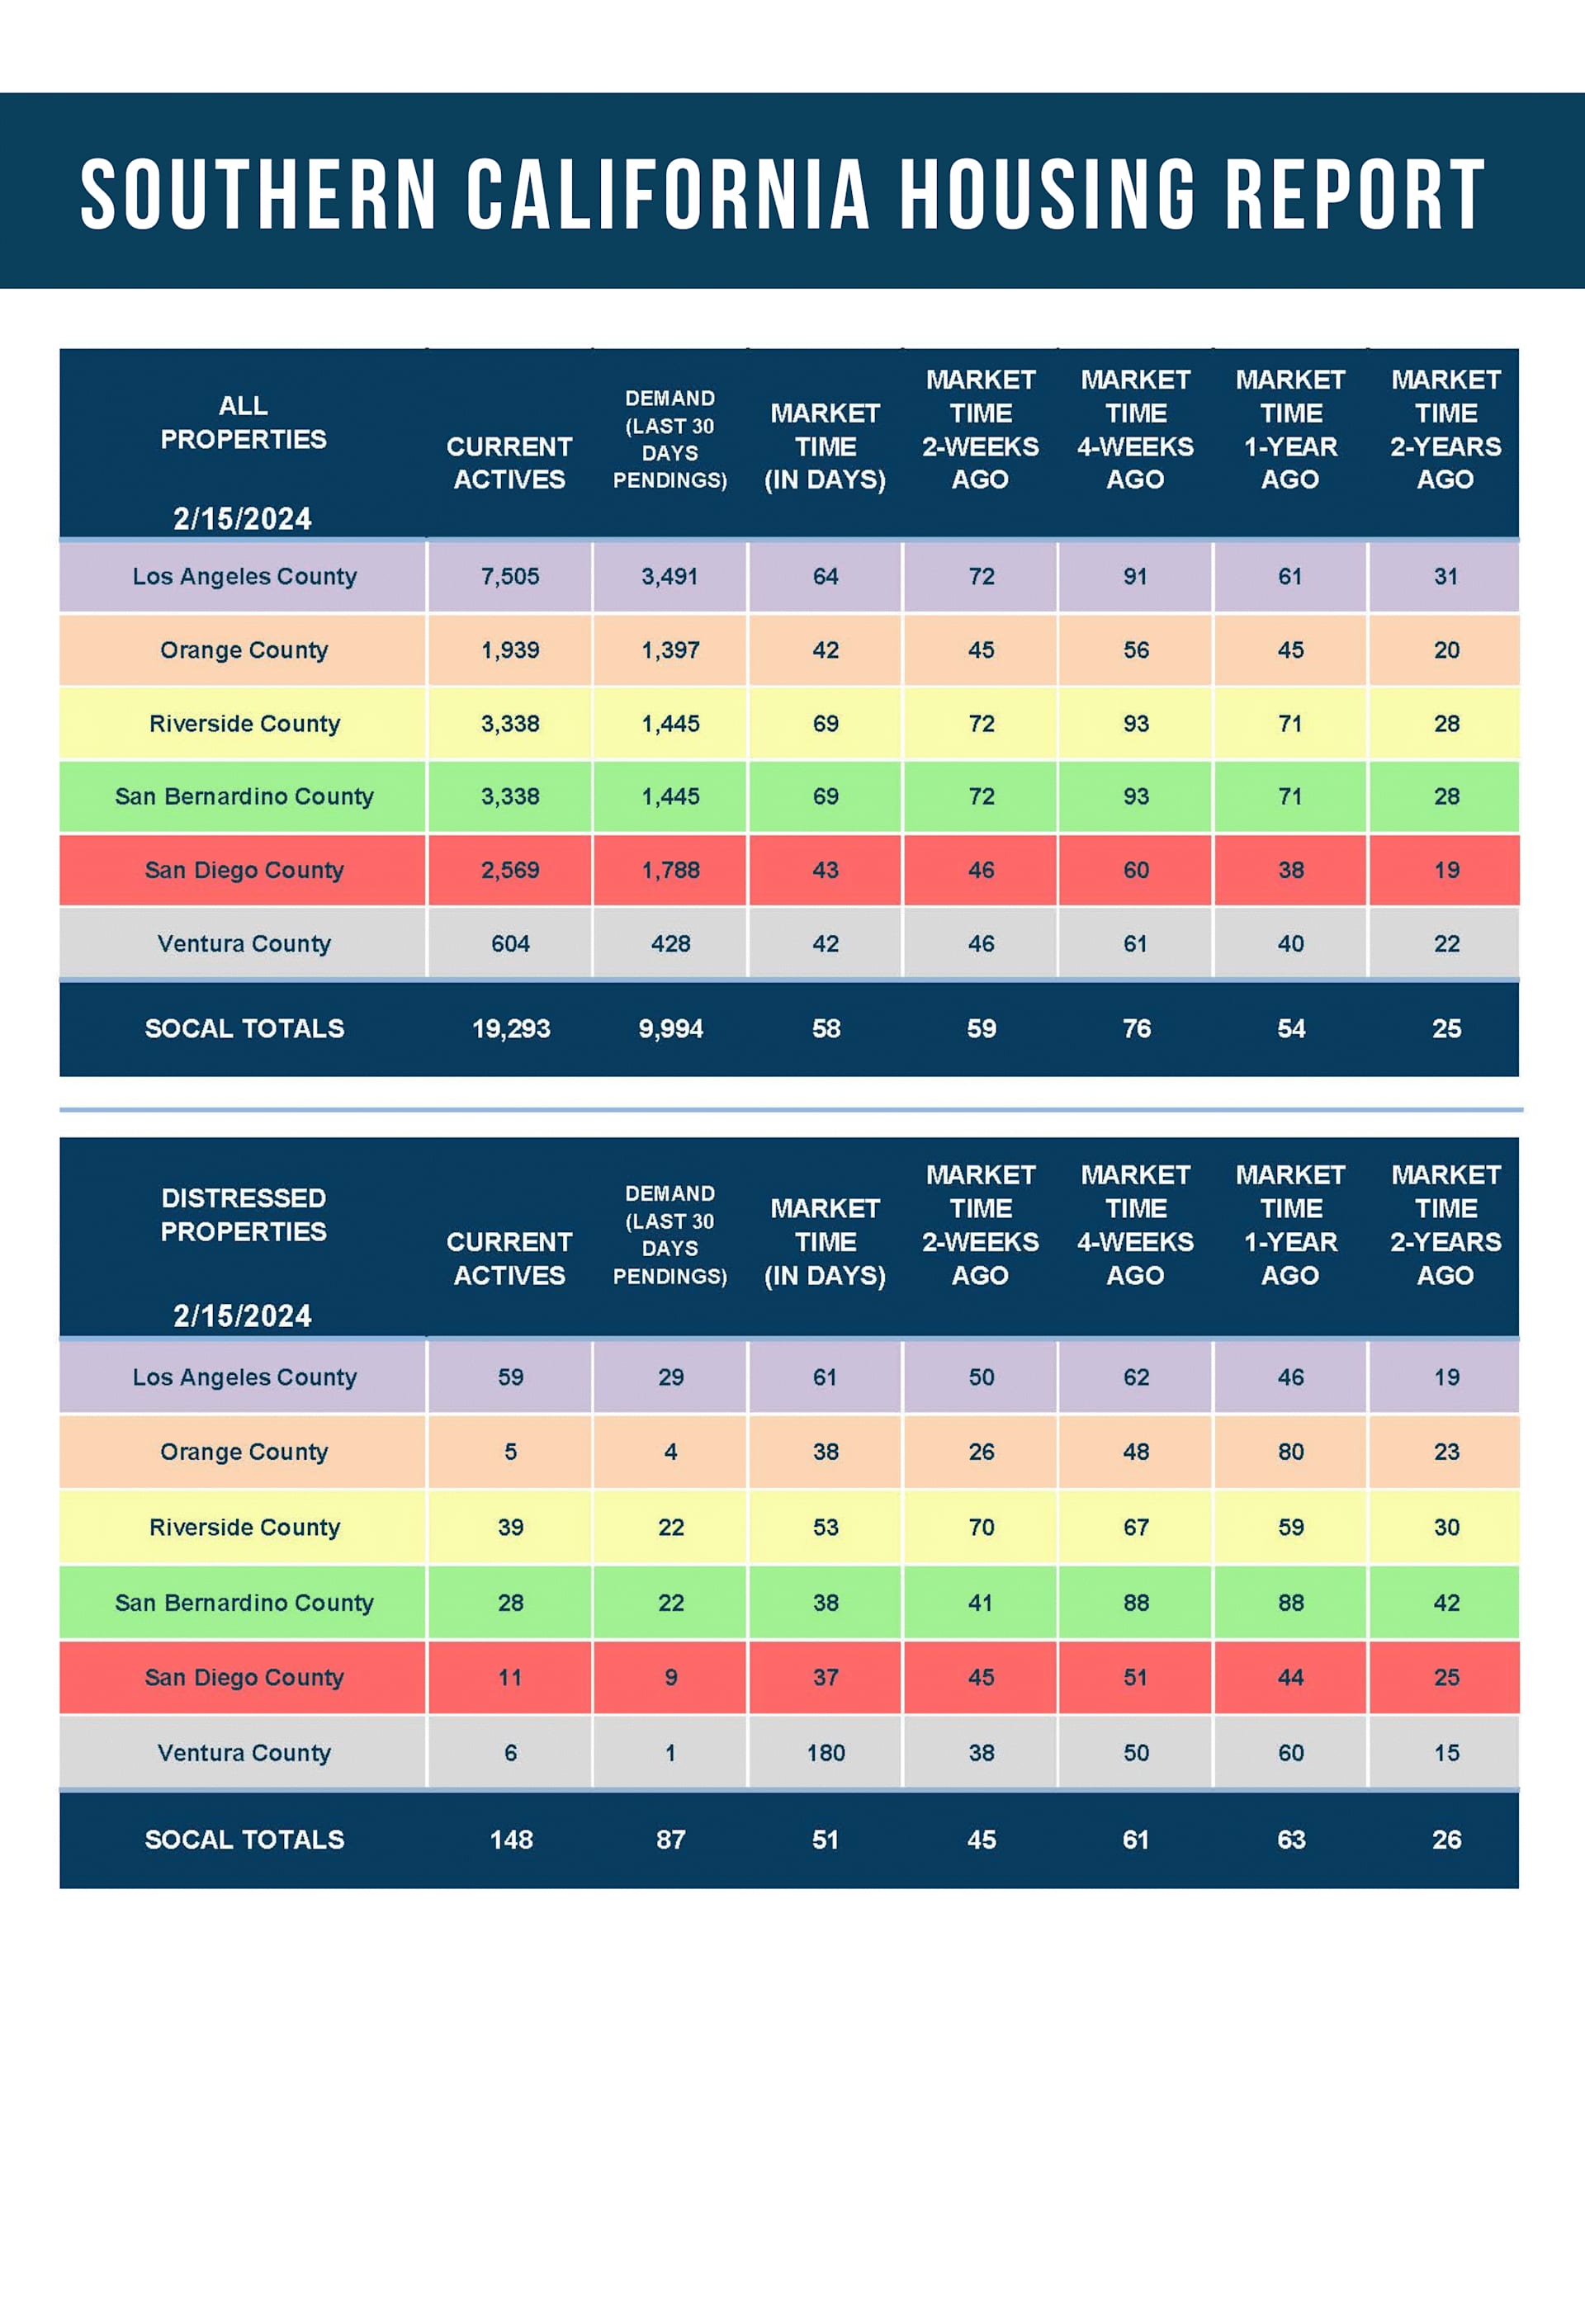
Demand, a snapshot of new pending sales over the prior month, had been closely mirroring the previous year in December and January but is now off by 9%. Demand is currently at 1,397 pending sales compared to 1,537 last year, which is 140 fewer. The only real difference is that mortgage rates migrated back up to 7%. In February 2023, mortgage rates averaged 6.6% versus 7.0% so far this February. Affordability absolutely has had an impact on demand.
As mortgage rates migrate higher, demand slows, and the market speed slows. Rising rates are like removing pressure on the housing market gas pedal. As the economy cools, which is projected to happen sometime this year, rates will fall, and the Fed will start slashing the short-term Federal Funds rate. Home affordability will improve as rates migrate downward. At 6%, the buyer looking for a $5,000 payment could afford a $1,042,500 home, equating to $102,750 more purchasing power than 7%. As mortgage rates drop, demand improves, and the speed of the market accelerates. The lower rates fall, the more pressure is placed on the housing market gas pedal, and the hotter the housing market will become.
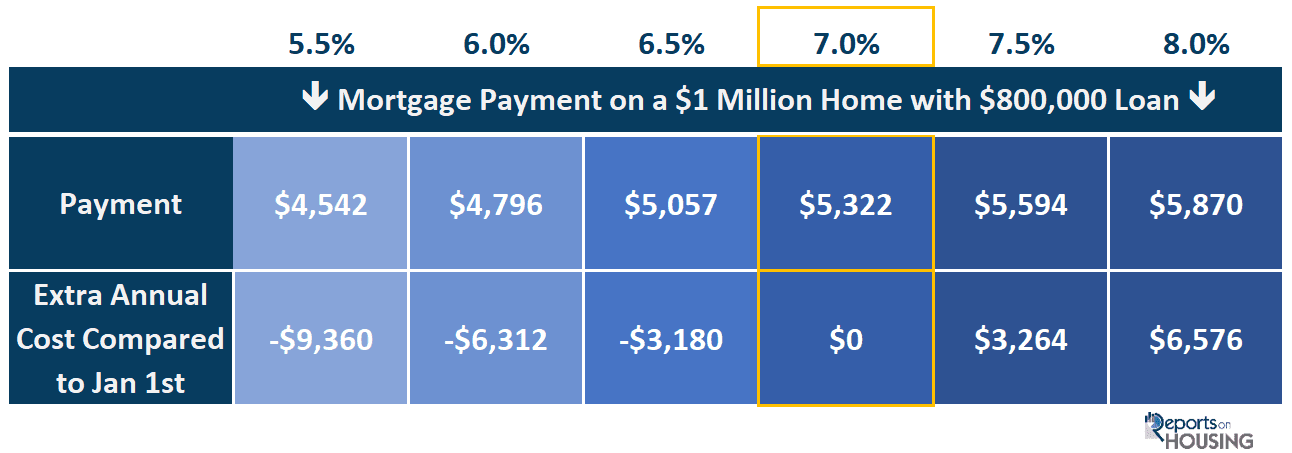
Another way of looking at affordability is to look at various payments for a home based on changing mortgage rates. Buyers looking to purchase a $1 million home with 20% down would be looking at a monthly principal and interest payment of $5,322 at today’s 7% rate. When rates were at 8% last October, the payment was $5,870, an additional $548 per month or $6,576 per year. Yet, as many economists project, if rates drop to 6%, the monthly payment would fall to $4,796, a $526 monthly savings compared to 7%, or $6,312 per year.
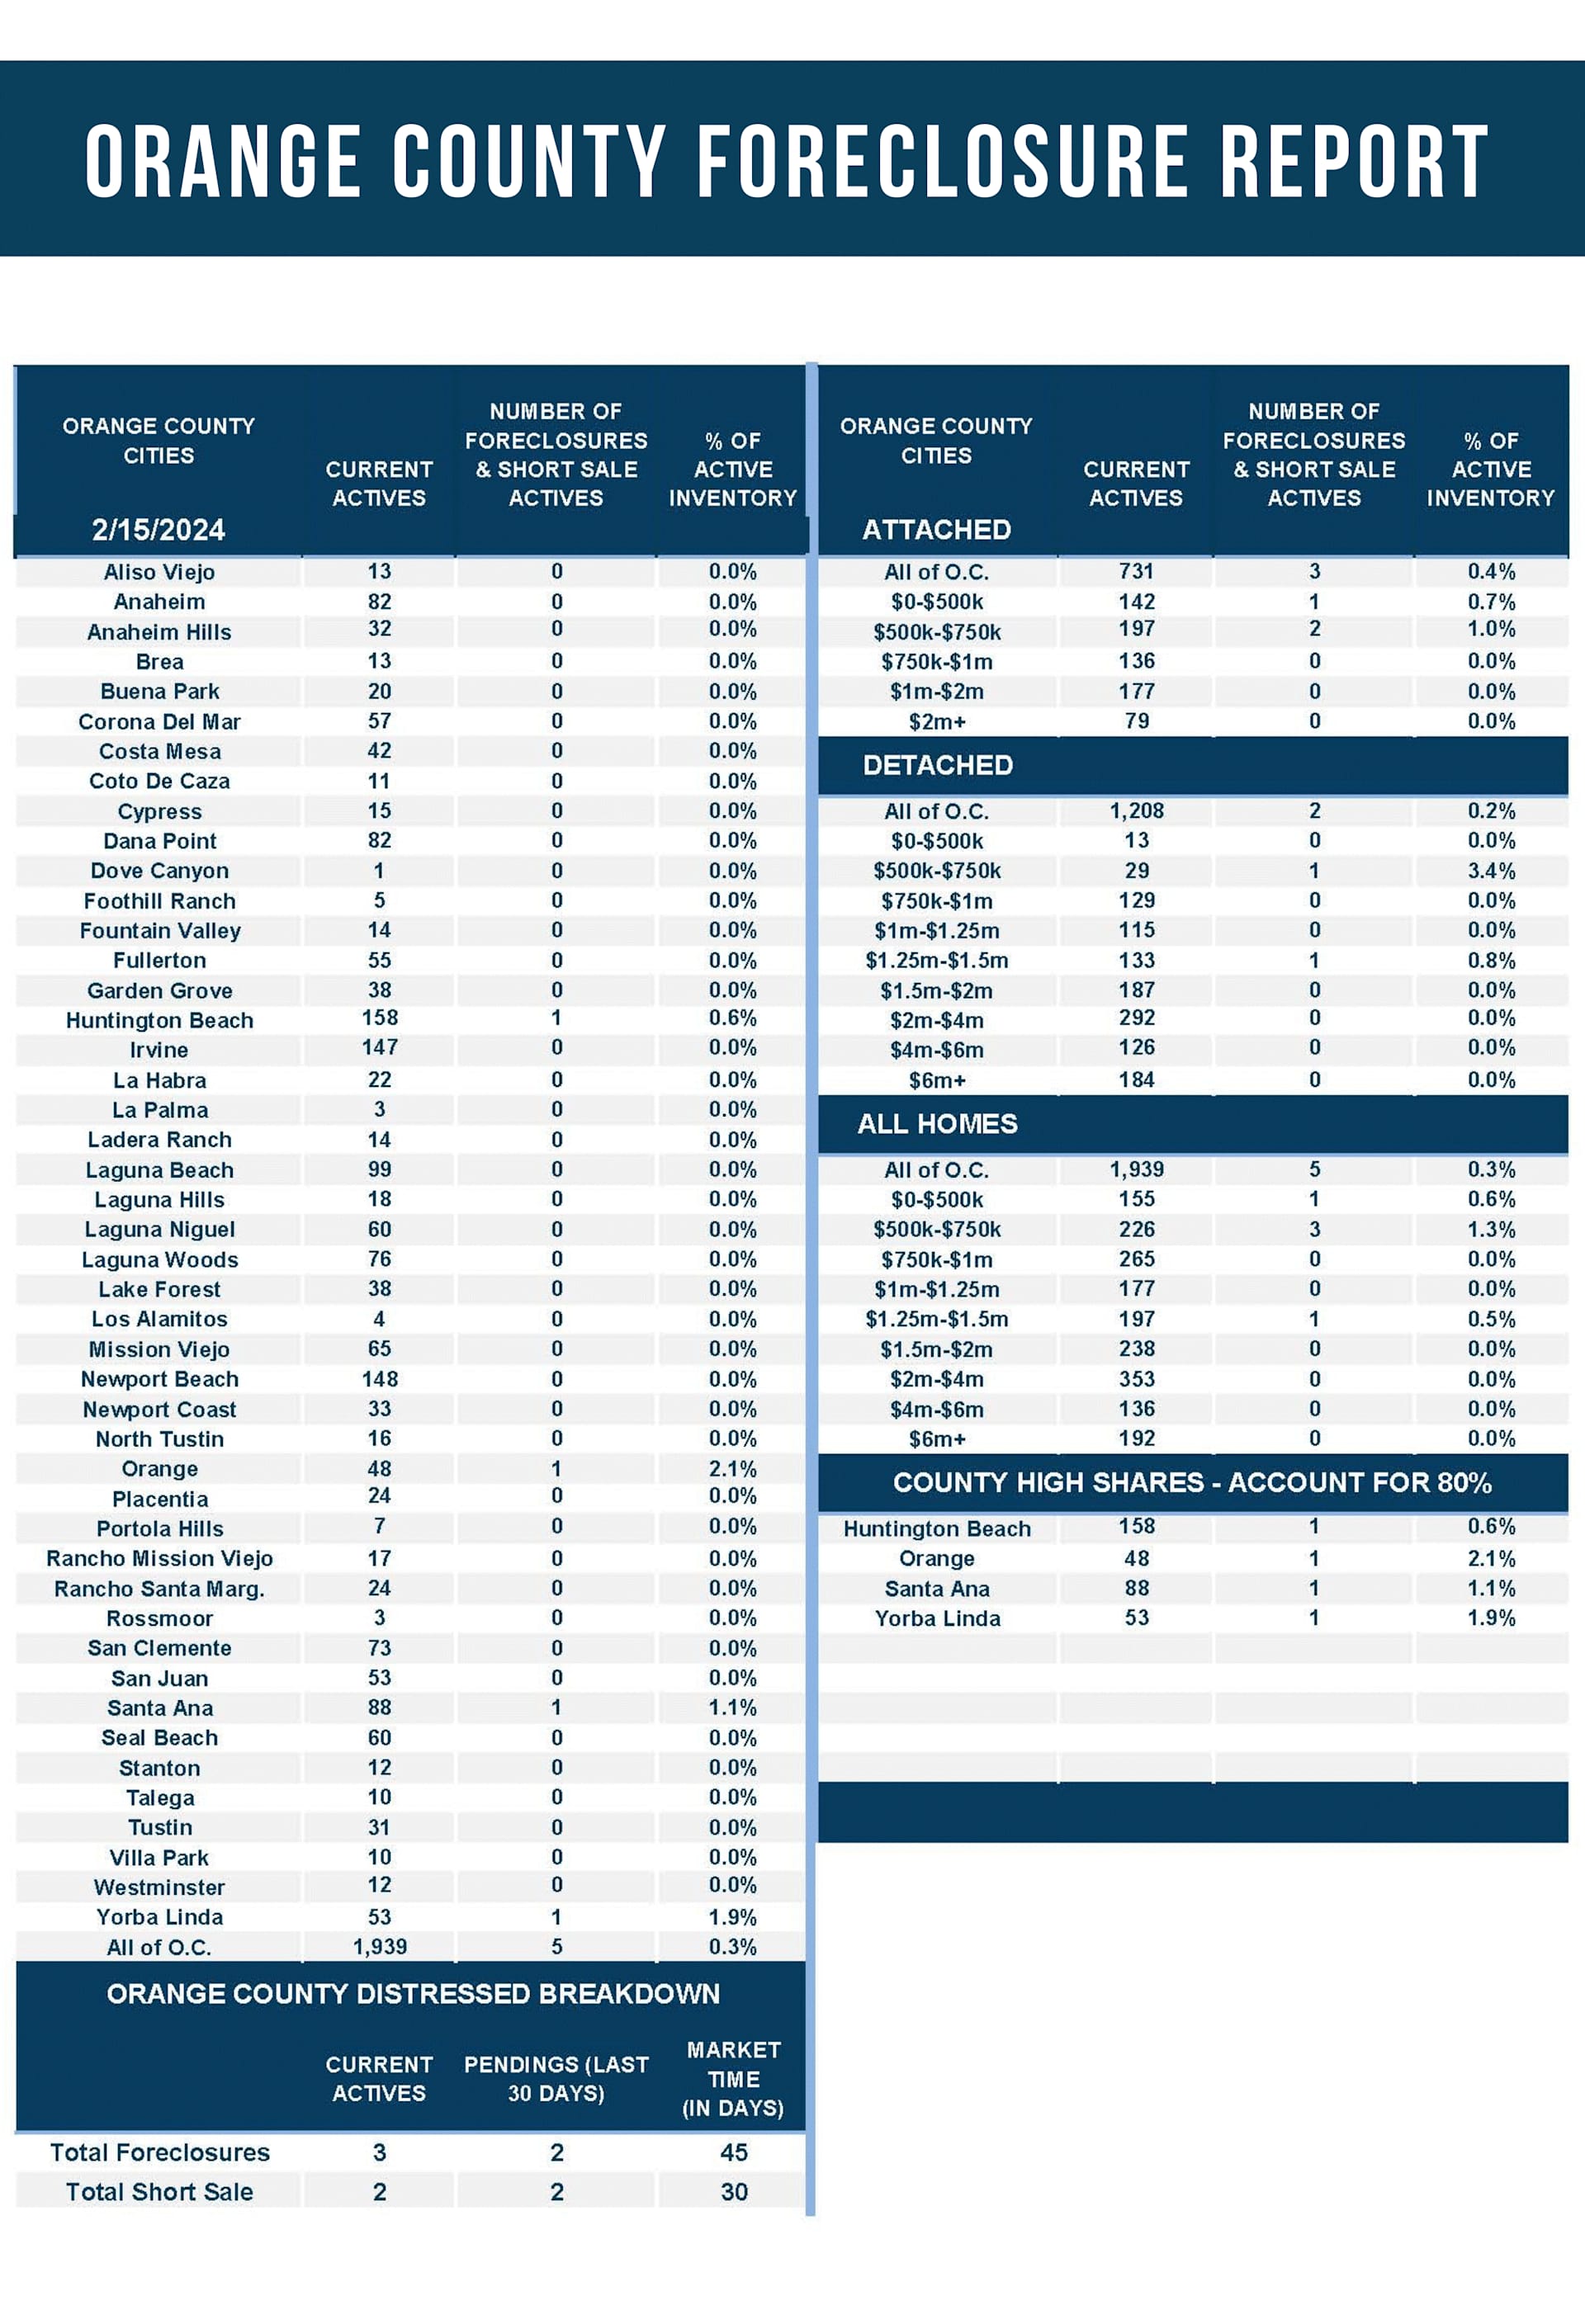
Higher rates dampen housing activity. It not only impacts demand, but it also affects the number of homeowners willing to sell. An astonishing 85% of all homeowners with a mortgage have a rate at or below 5%. Many have rates far below that threshold. Nearly a third, 30%, have a mortgage at or below 3%. Higher rates cut into affordability, and fewer homeowners are willing to part with their low fixed-rate payments in exchange for a much higher mortgage rate and payment. In 2023, 41% fewer Orange County homeowners were willing to sell their homes compared to the 3-year average before COVID (2017 to 2019), a mindboggling 16,110 fewer FOR-SALE signs.
When mortgage rates migrate lower, not only will demand rise, but the number of homeowners willing to sell will rise. The closer rates dive toward 6%, the more inclined homeowners will be to list their homes. When rates eventually fall below 6% and into the upper 5% level, the needle will move even further for the number of homeowners willing to participate in the housing arena. Just as 7% is a psychological barrier for so many consumers that ultimately downshifts the speed of the housing market as rates surpass that mark, 6% is another psychological barrier where housing will heat up noticeably as rates drop into the 5’s.
The Orange County housing market is particularly rate-sensitive. As rates slowly migrate higher, the market cools, limiting supply and demand. When rates eventually fall, demand will rise, more homeowners will sell, the housing market will speed up, and there will be a noticeable increase in closed sales.
The active inventory was flat in the past couple of weeks.
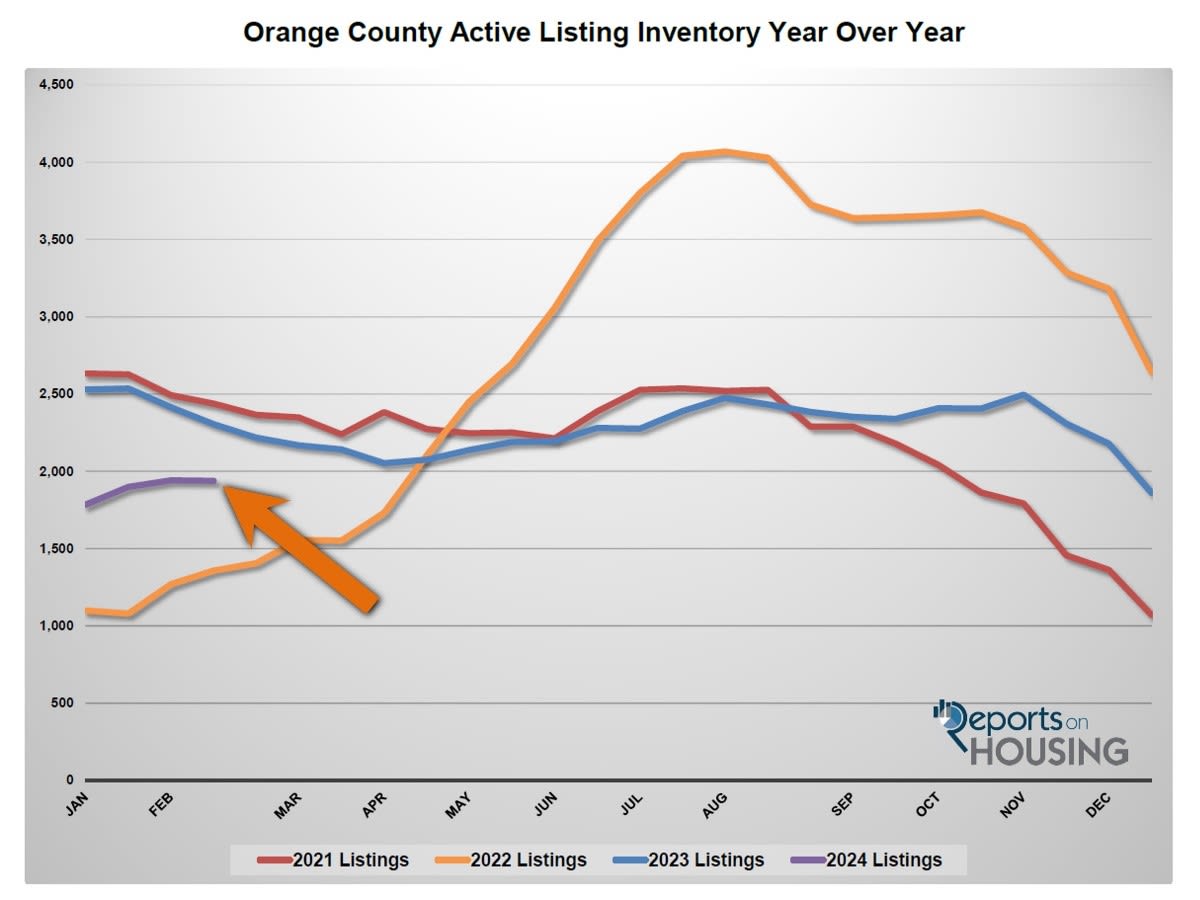
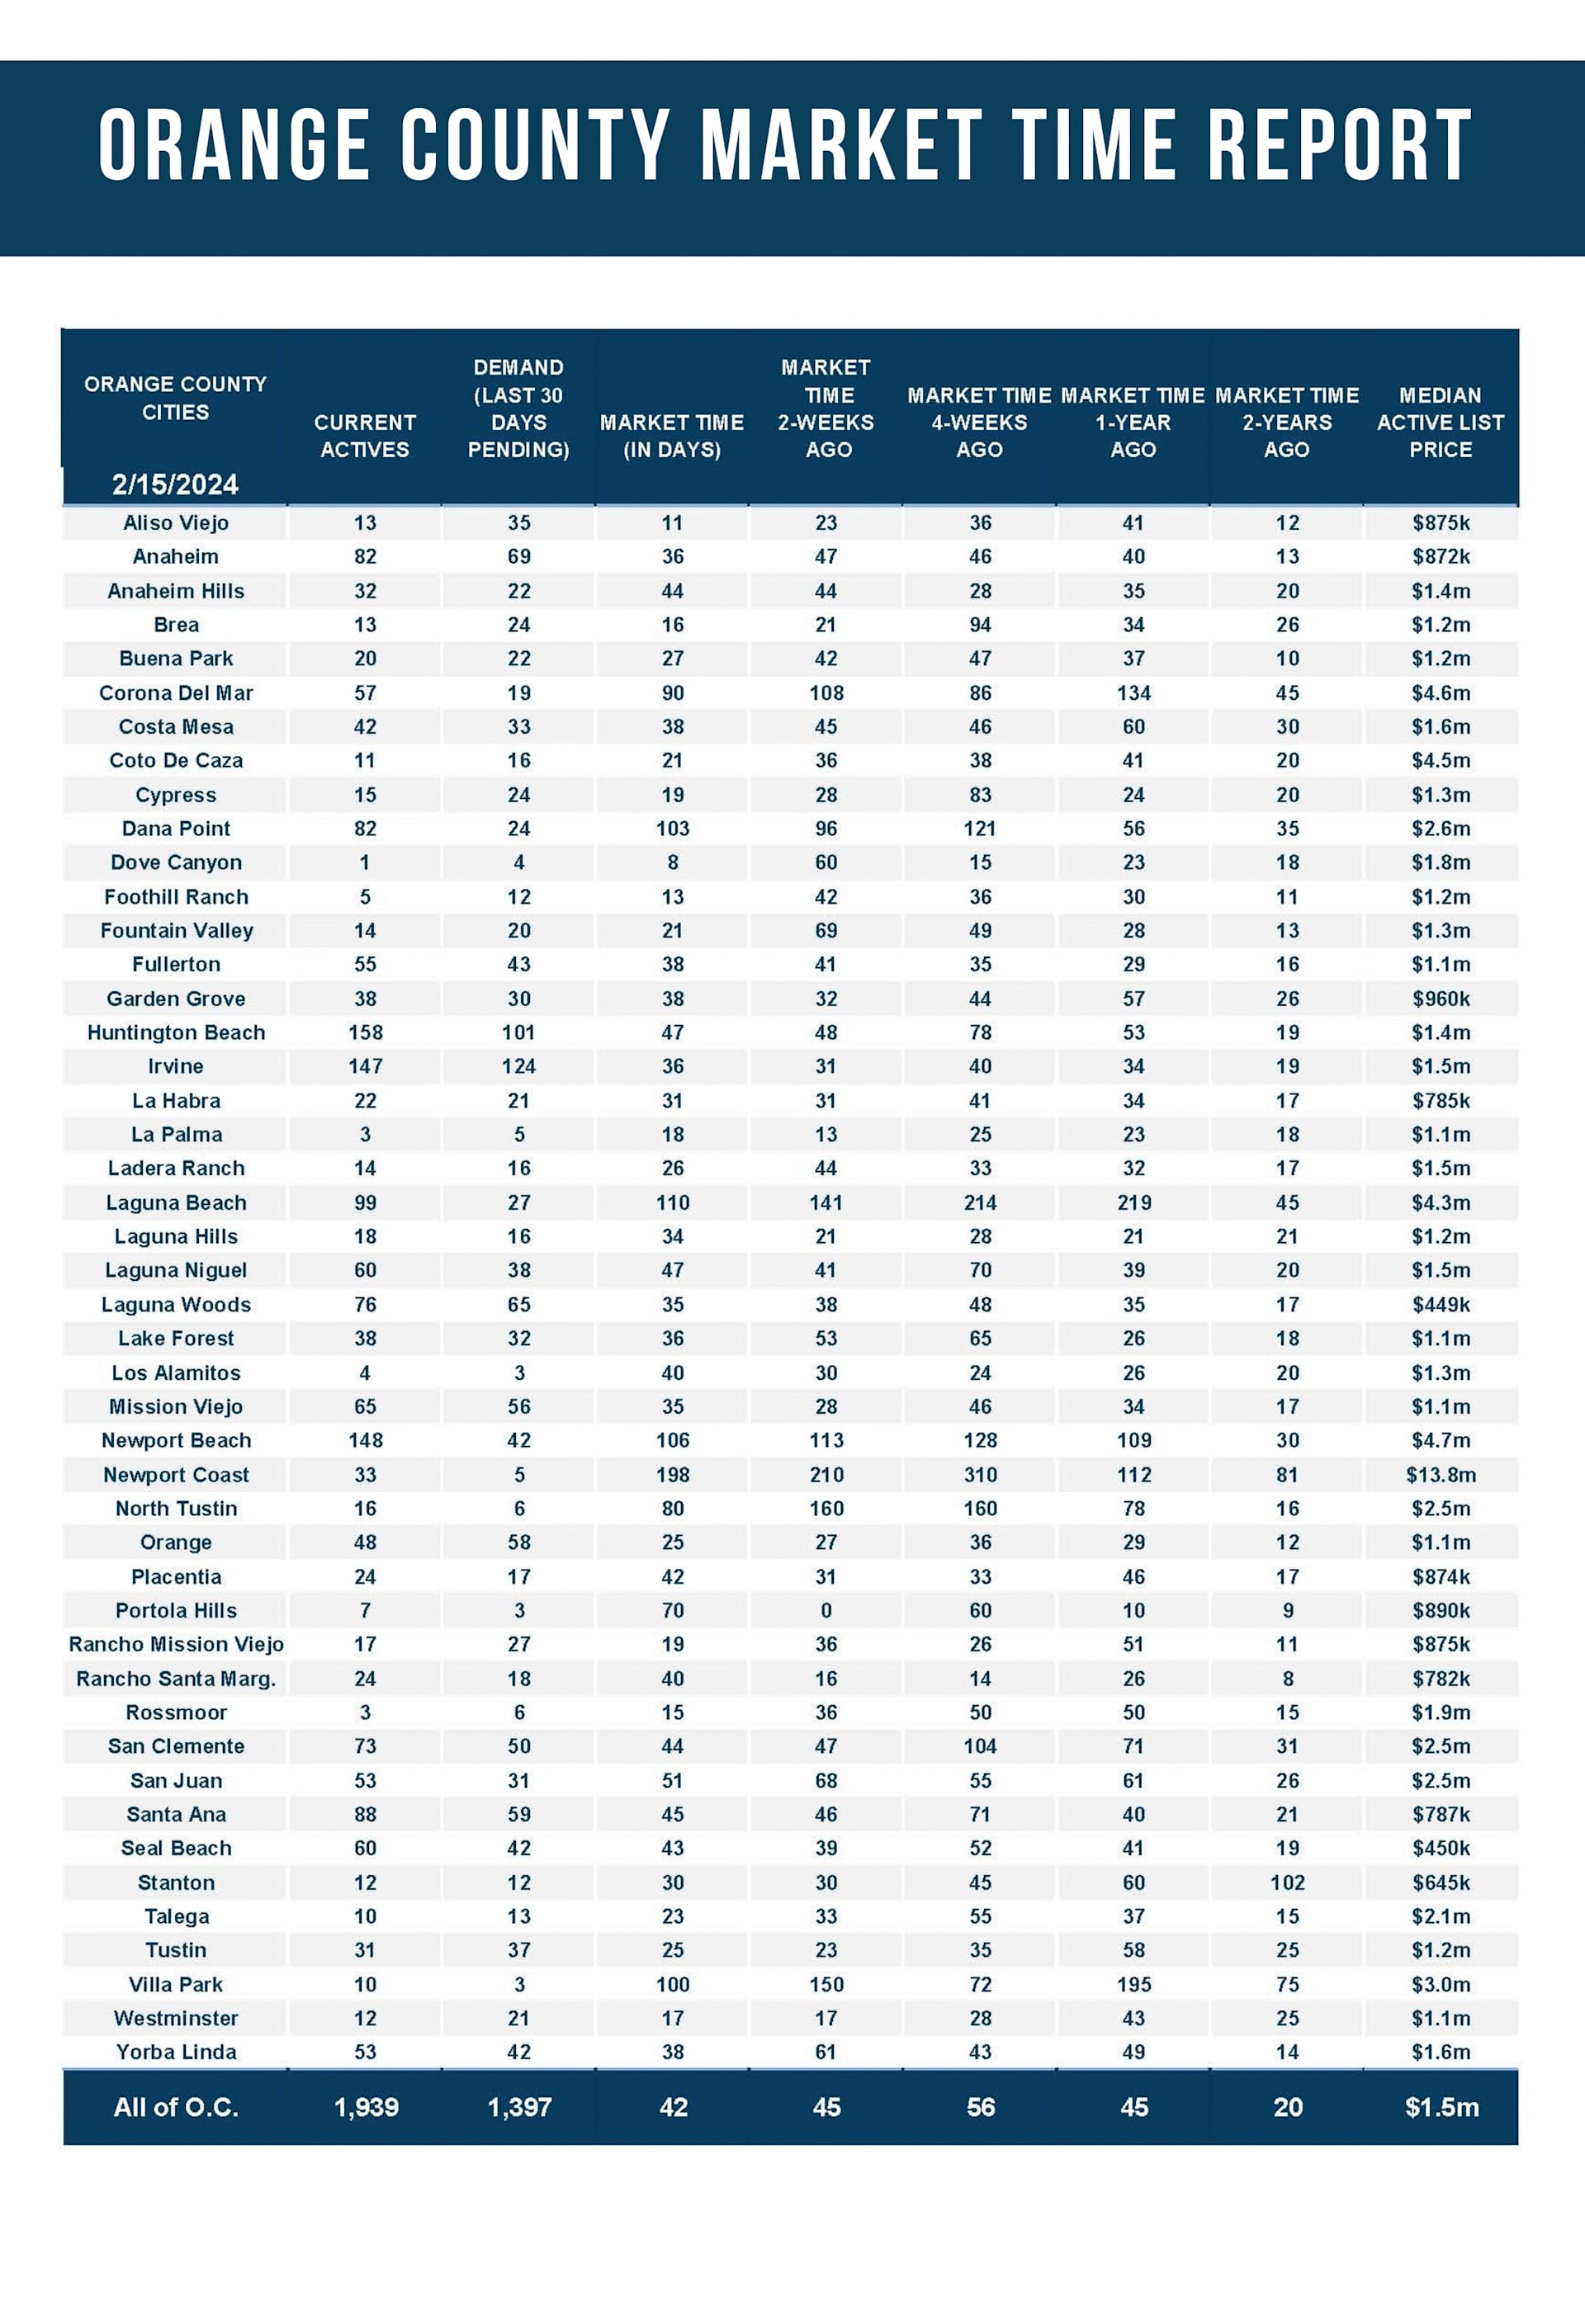
The active listing inventory decreased by three homes in the past two weeks, nearly unchanged, and now sits at 1,939. Last year, the inventory dropped from week to week and reached a bottom in mid-April. This year, after initially climbing during January, the inventory has remained relatively flat. The bottom line is that the number of available homes has not changed much so far this year. That is precisely what occurs during the Winter Market; the inventory rises a bit, remains flat, or drops slightly. It is in mid-March that the inventory typically rises at a much faster pace. The issue is that the housing market has not behaved normally since pre-COVID. If rates remain stubbornly at 7% or higher, the inventory is much more likely to finally rise during the Spring Market. A lot can happen with rates over the next four weeks. If they fall by the start of spring, it will be much harder for inventory levels to grow. The trajectory of the inventory will rely on the trajectory of rates this year.
Last year, the inventory was 2,305 homes, 19% higher, or 366 more. The 3-year average before COVID (2017 through 2019) was 4,977, an additional 3,038 homes, or 157% extra, more than double where it stands today.
Homeowners continue to “hunker down” in their homes, unwilling to move due to their current underlying, locked-in, low fixed-rate mortgage. For January, 1,982 new sellers entered the market in Orange County, 1,072 fewer than the 3-year average before COVID (2017 to 2019), 35% less. Last January, there were 1,705 new sellers, 14% fewer than this year. More sellers are finally opting to sell compared to the prior year.
Demand increased by 8% in the past couple of weeks.
Demand, a snapshot of the number of new pending sales over the prior month, increased from 1,290 to 1,397 in the past couple of weeks, up 107 pending sales, or 8%, its highest level since September. Yet, it is the lowest mid-February reading since tracking began in 2004. Surprisingly, demand is lower than last year despite more homes coming on the market. This has everything to do with affordability and rates climbing above 7%. The direction of demand depends upon the direction of mortgage rates. Mortgage rates will noticeably fall along with data that details a cooling economy, which is what the Federal Reserve wants to see before cutting the short-term federal funds rate. When rates fall, demand will increase along with affordability. When that occurs, demand will be higher than last year. Precisely when that happens is anybody’s guess. It all depends upon the many monthly economic readings.
Last year, demand was 1,537, 10% more than today, or 140 extra pending sales. The 3-year average before COVID (2017 to 2019) was 2,393 pending sales, 71% more than today, or an additional 996.
With demand rising and supply unchanged, the Expected Market Time (the number of days to sell all Orange County listings at the current buying pace) decreased from 45 to 42 days in the past couple of weeks, its lowest level since June. Last year, the Expected Market Time was 45 days, similar to today. The 3-year average before COVID was 64 days, slower than today.
The luxury market has improved dramatically in the past couple of weeks.
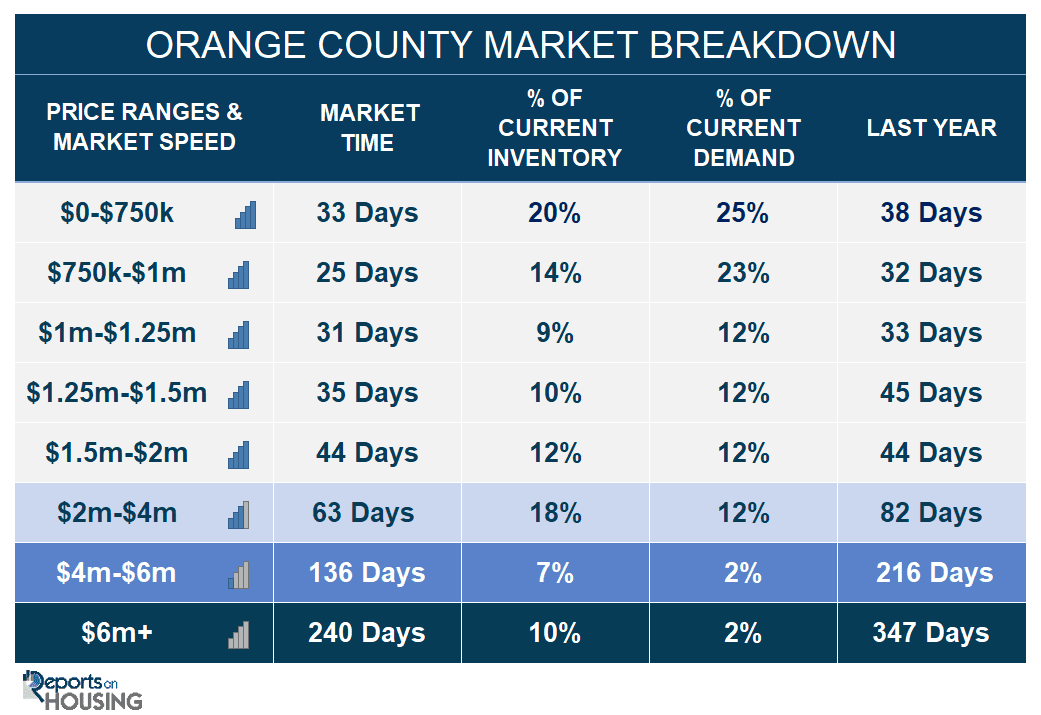
In the past couple of weeks, the luxury inventory of homes priced above $2 million increased from 675 to 681 homes, up six, or 1%. Luxury demand jumped by 43 pending sales, up 24%, and now sits at 222, its highest level since Mary 2022. With demand surging higher compared to the smaller rise in supply, the Expected Market Time for luxury homes priced above $2 million plunged from 113 to 92 days, its lowest reading since May 2022. The luxury price ranges are heating up and are more resilient and stronger than last year.
Year over year, luxury demand is up by 72 pending sales or 48%, and the active luxury listing inventory is up by 75 homes or 12%. Last year’s Expected Market Time was 121 days, slower than today.
For homes priced between $2 million and $4 million, the Expected Market Time in the past two weeks decreased from 80 to 63 days. For homes priced between $4 million and $6 million, the Expected Market Time increased from 133 to 136 days. For homes priced above $6 million, the Expected Market Time decreased from 337 to 240 days. At 240 days, a seller would be looking at placing their home into escrow around October 2024.